Showing posts with label Kibana. Show all posts

Thursday, March 30, 2023

Sending Kibana (free/open source) Alerts via Webhook Using Fluent-Bit (free)


Background

This is a case where we helped a customer save quite a bit of money by using software they already owned rather than paying a large upcharge for additional licenses that they didn't need.

For any number of good reasons, your use case only calls for the free version of Elastic in your environment. In your environment, you also want to integrate alerts with your ticketing system. The challenge is that the free version of Kibana does not include a webhook connector for alerts. Only the Server log connector is available with the free license, whereas the Webhook connector (and others) are only available with the paid licenses.

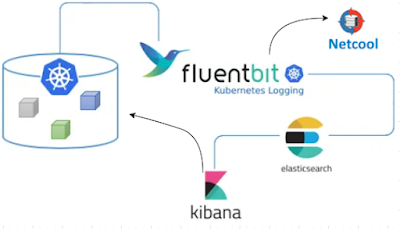
I have a customer in the above situation. An application they purchased is bundled in an appliance running a packaged Kubernetes distribution. The application also includes Fluent Bit for log collection into Elasticsearch. The initial challenge was to send alerts to their on-prem Netcool environment when certain log messages were written. We helped them meet this challenge using the webhook output of Fluent Bit to send the appropriate messages to the Netcool message bus probe, which would then create an incident in their ticketing system for each of these alerts.

Their next requirement was to only create incidents based on some aggregation of log messages. Specifically, they obtained several Elasticsearch queries from the vendor that should be used to generate incidents. This is really straightforward when using one of the paid Elastic licenses because you can simply write a rule with the Elasticsearch query as a condition and the built-in webhook connector to define an action that sends a message. With the free license of Kibana, that connector isn't available. 

My Solution

The trick to the solution in this case is to just use the Server Log connector in Kibana to write a specifically-formatted message to the log when the Elasticsearch query condition is met. The message can be similar to:

CREATE_INCIDENT Vendor Query X has breached the prescribed threshold. Take action Y to correct.

This message is written to the log file for the Kibana pod, which is already being tail'ed by Fluent Bit. So we just needed to create a FILTER in Fluent Bit to match this log message and route that to the message bus probe. 

Wednesday, March 29, 2023

Modify kibana.yml after deploying Kibana with Helm

If you deploy Kibana using the Elastic helm chart with default values, what you'll find is that you don't have any obvious way to modify the kibana.yml file. For example, if you log into the Kibana pod with

kubectl exec --stdin --tty kibana_podname -- /bin/bash

you'll find that there's no editor available (like vi or even ed). You can cat config/kibana.yml, but the comments state that it is auto-generated. So what are you supposed to do to add an a setting to the file? For example, you might need to add a value for xpack.encryptedSavedObjects.encryptionKey so you can configure alerting.

The solution I came up with is a multi-step process:

1. Get the default values.yaml file for the chart and store that in a file with the command:

helm show values elastic/kibana > /tmp/kibana.yaml

2. Edit that file to add a section for kibana.yml under kibanaConfig. Originally, kibanaConfig is empty (set to {}). You need to change it to be something like:

kibanaConfig:
   kibana.yml: |
      xpack.encryptedSaveObject.encryptionKey xxxxxxxxxxxxxxxxxxxx


3. Now (unintuitively at least to me) uninstall the helm chart with:

helm uninstall kibana

3. Then install the helm chart again with:

helm install kibana elastic/kibana -f /tmp/kibana.yaml

And that's it. Your changes will be applied and you're good to go.

I'm pretty sure there's a way to create a configMap and reference it, which would then allow you to just delete the pod to have it re-read the configMap, but I haven't figured out those exact details. Maybe in another post.

Tuesday, October 16, 2018

You can now use Vega to create custom graphs in Kibana

Prior to Kibana 6.2, you had to create a custom plugin to create custom visualization types. Now, however, support for Vega is included. Vega is a JSON (HJSON, actually) language that you can think of as a wrapper around the D3 visualization toolkit to allow it to display in Kibana. Here's a video with the highlights:

https://www.youtube.com/watch?v=lQGCipY3th8