While Bruno Portaluri left IBM a few months ago, he is still updating and maintaining MxLoader. He made his most recent updates on Nov 14, 2017, available here:
https://www.ibm.com/developerworks/community/groups/service/html/communityview?communityUuid=220c5757-ac28-4f25-bd08-457c5a3364c3#fullpageWidgetId=W9cbbfec147e6_4341_9578_7671e722619f&file=31d8347f-219f-45b2-a1d2-18f777e38810
Friday, November 17, 2017
Friday, November 3, 2017
Canada's Secret Spy Agency Has Open-Sourced a Malware-Fighting Tool
A link to the code:
https://bitbucket.org/cse-assemblyline/
All of the details about the release can be found here:
http://www.cbc.ca/news/technology/cse-canada-cyber-spy-malware-assemblyline-open-source-1.4361728
Every IT department in the world should download and use this if they don't already have something in place.
Thursday, November 2, 2017
We're a sponsor at Pink18 in Orlando!
We'll be a sponsor of the Pink18 conference in Orlando, Florida Feb. 18-21, 2018. Come by booth #601 to see what we're offering or just to say hi.
Tuesday, October 24, 2017
How Netcool Operations Insight delivers cognitive automation by Kristian Stewart
https://www.ibm.com/blogs/cloud-computing/2017/08/netcool-operations-insight-cognitive-automation/
One important topic that Kristian omitted from his excellent article is the optional Agile Service Manager (ASM) component of NOI. ASM provides a context aware topology view of your applications and infrastructure, which gives you a clear view of the impacts causes by events. Take a look at our other articles and YouTube videos for more information on ASM.
Friday, October 13, 2017
What to use instead of ITMSuper
ITMSuper is a JavaScript based tool that can be used for maintaining the health of your ITM 6.x environment. It was written by IBM and made available as a separate download, but was never completely supported. It's even less supported today, as it only supports Internet Explorer 8. Here is a great blog post from Shaun R at IBM pointing to different tools that you should use instead, all written by IBM's own John Alvord:
https://www.ibm.com/developerworks/community/blogs/0587adbc-8477-431f-8c68-9226adea11ed/entry/Helping_us_help_you_ITM_Bitesize_Edition_ITMSuper?lang=en
https://www.ibm.com/developerworks/community/blogs/0587adbc-8477-431f-8c68-9226adea11ed/entry/Helping_us_help_you_ITM_Bitesize_Edition_ITMSuper?lang=en
Wednesday, October 11, 2017
Free mobile app for monitoring the status of your Maximo and ICD environments
I just found the MxAdmin app in IBM Marketplace:
https://www.ibm.com/us-en/marketplace/mxadmin
It was written by A3J Group and appears to have some pretty nice functionality.
https://www.ibm.com/us-en/marketplace/mxadmin
It was written by A3J Group and appears to have some pretty nice functionality.
Wednesday, September 20, 2017
IBM Control Desk 7.6.0.3 is available
Introduction
IBM has released the ICD 7.6.0.3 FixPack:https://www-945.ibm.com/
Installation issues
On linux, the service_portal.bin installer crashes unless you use the "-i silent" install option. See this link for more information:
New/Updated Functionality
Here are IBM's links for the new capabilities:
Control Desk Platform
-------------------------------------
Control Desk Service Portal
-------------------------------------
I've found a couple of additional things that have been fixed that I didn't find in the documentation. Specifically:
Service Portal
- Default values for specifications now completely work. This means that you can specify a default value for a specification for an offering, and you will see that default value filled in when you go to request that offering.
- Specifications tied to Table Domains now work again. This function existed in 7.6.0.1, but was broken in 7.6.0.2, and is now back. Specifically, if you define a specification to be tied to a table domain, when you click in the field for that specification in the offering, you'll get a popup with all of the possible values.
- Users can add an attachment before hitting the Submit button. One thing this allows you to do is require an attachment through the use of an "Add to Cart" or "On Submit" validation script.
Update 9/25/17: Control Desk Platform
The Person Groups "Group Availability" Gantt chart works now. It was broken in 7.6.0.1 and 7.6.0.2, but it does work again in 7.6.0.3.
Monday, September 11, 2017
Force change of global system property in Maximo
UPDATE 6/3/2020
Another way to resolve this issue is to point to a local maximo.properties file as described here:
And put the mxe.report.birt.viewerurl property in that file.
Introduction
I recently encountered an issue in one of my ICD 7.6 installations where a global system property had an incorrect value set that I needed to change without rebuilding my MAXIMO.EAR file. This post is a description of the problem and my eventual "fix". It's just a test environment, and this is NOT a resolution that I would recommend for a production system. But I wanted to document the details to possibly help others in similar situations.
Problem
I installed ICD 7.6 and chose to use the maxdemo DB2 database script during configuration. This apparently set the mxe.report.birt.viewerurl global property to
http://myhostname.domain.name/maximo/reports/ , and that is an invalid value. This system property should either be unset or set to
http://myhostname.domain.name/maximo/report (with no trailing "s"). The problem that this causes is that any attempt to click on the "Run reports" action gives an HTTP 404 error.
It took a while to run this down, but finally looking in System Configuration->Platform Configuration->System Properties showed me the setting for this system property:

Notice that I'm unable to modify the value AND "File Override?" is checked. So this means the value is set somewhere in the filesystem. Unfortunately, I couldn't find the value anywhere in any file on the system, so the only normal way around this is to modify maximo.properties on the Admin workstation, rebuild MAXIMO.EAR, then redeploy the EAR file. But I didn't want to do that for various reasons. Also, since "Global Only?" is set to true, I couldn't create an instance-specific property with the same name and different value.
My "solution"
I tried several different tactics, but the one that finally worked for me was to directly update the database to set "User Defined?" true for this property so I could then delete it and create an instance-specific property with the same name. The SQL command I used to make this change was:
update maxprop set userdefined=1 where propname = 'mxe.report.birt.viewerurl'
After running the above SQL command from a DB2 command prompt, I could then create an instance-specific property with the same name but with the correct value. Once I did that, I was able to successfully run all* BIRT reports.
All* reports?
Actually, the demo database script has at least one problem. Specifically, the CI named RBA_SERVER has a problem that causes the "CI List" report to fail. To get around this issue, you need to first find and delete the WORKORDER that references the RBA_SERVER CI, and then you can delete the RBA_SERVER CI. Once you delete that CI, you'll be able to successfully run the "CI List" report.
Tuesday, September 5, 2017
Disabling IE Enhanced Security Mode on Windows 2012 Server
Here's a handy PowerShell script I found to disable IE Enhanced Security Configuration on Windows 2012 Server. This needs to be run as Administrator:
function Disable-IEESC
{
$AdminKey = "HKLM:\SOFTWARE\Microsoft\Active Setup\Installed Components\{A509B1A7-37EF-4b3f-8CFC-4F3A74704073}"
$UserKey = "HKLM:\SOFTWARE\Microsoft\Active Setup\Installed Components\{A509B1A8-37EF-4b3f-8CFC-4F3A74704073}"
Set-ItemProperty -Path $AdminKey -Name "IsInstalled" -Value 0
Set-ItemProperty -Path $UserKey -Name "IsInstalled" -Value 0
Stop-Process -Name Explorer
Write-Host "IE Enhanced Security Configuration (ESC) has been disabled." -ForegroundColor Green
}
Disable-IEESC
Friday, August 18, 2017
A new IBM Redbook on writing applications with Node.JS, Express and AngularJS
IBM just published another great Redbook, this time on application development with Node.JS, Express and AngularJS:
http://www.redbooks.ibm.com/redbooks/pdfs/sg248406.pdf
It describes the process on BlueMix, but it is applicable to a local application also.
What I like about it is the intricate detail it goes into for each and every step of the process and line of code in the application. It includes a ton of details about exactly what is going on with each step. If you're just learning these technologies or want a primer, this is an extremely informative resource.
Monday, July 31, 2017
Debugging Remote Control in IBM Control Desk
Introduction
One of the many great features in IBM Control Desk is the ability to have a service desk agent remotely take control of a user's machine for troubleshooting (or repair) purposes. This function leverages the IBM BigFix for Remote Control agent on the target machine and a JNLP file on the server that launches a JAR file on the agent's machine.Architecture
The architecture is fairly simple. The JAR file running on the agent's machine communicates DIRECTLY with the BigFix Remote Control agent on the user's machine, which listens by default on port 888. This means that any firewalls between the agent's machine and the user's machine must allow a connection to port 888 on the user's machine.Installing the Agent on the User's Machine
If you manually install the agent, it prompts you for the server name and port, but these values are ignored if you don't have BigFix in your environment. So if you don't have BigFix in your environment, these two values can be anything you want - it doesn't matter. It also asks you for the port that the agent should listen on. This is 888 by default, but can be changed to anything you'd like.Launching the Controller Interface in debug mode on the Agent's Machine
This can be done in several ways from the ICD GUI, but going that route doesn't actually allow you to put the Controller interface into debug mode. To do that, you need to copy the TRCConsole.jar file from any of your ICD application servers or from the Administrative Workstation. Search for the file by name and you'll find it. Copy this file to the agent's machine.
On the agent machine, you need to launch the JAR file with the --debug flag:
TRCConsole.jar --debug
This will create a file named trctrace_<date_timestamp>.log in your %HOMEPATH% folder. This file will contain detailed tracing information that can be used for debugging.
Thursday, July 20, 2017
DevOps and Microservices Architecture done right - IBM Netcool Agile Service Manager
Introduction
Our last article described just how easy it is to upgrade any or all of the components of Agile Service Manager. This article is meant to describe some of the design, patterns and processes that had to go into the application itself to allow a two-command in-place upgrade.Microservices Architecture
Yes, this is a trendy buzzword these days, and that's only part of the reason I'm using it here. In general, a "microservice" can describe almost anything you access over the web - a website, a document, etc. Absolutely anything. But one very important concept about microservices when designing an application is separating functions that then expose all of their capability through some interface. In ASM, there are several "services", each of which is implemented in a Docker container. Each one of these "services" actually provides a number of related "microservices", which are then exposed via URLs accessible through the host system. All of these services communicate with one another through the exposed microservices.
ASM's strict separation of functionality allows a lot of flexibility in application development. For example, one service is the File Observer, which is used to read a file of a specific format, which contains topology information. The main purpose of this service is to read a file and convert it into data that is then sent to the Topology service, which is responsible for processing the data for its purposes and ultimately sending it to the Cassandra (database) service, which will persistently store the data on a filesystem that's available on the host and accessible via the Search/ElasticSearch service. Notice that this application pattern is very similar to existing application patterns, but in this case each service is provided by a separate container.
Containers vs VMs
Docker containers are MUCH smaller than full virtual machines. Additionally, Docker has defined and implemented numerous usecases that make containers easier to create, deploy, configure and orchestrate than VMs. So, while ASM could have been delivered as multiple VMs (via OVA files and some type of hypervisor-specific orchestration), the use of Docker containers makes deployment and management much simpler. I'm saying that a similar result could have been achieved with VMWare vSphere, but IBM's Docker solution for this application seems to be sleeker to me.
Containers vs J2EE Applications in an App Server
In many ways, Docker can be seen as similar to a J2EE Application Server like WebSphere - it provides a common architecture with functions, capabilities and services that are shared among the applications/containers running within it. However, Docker containers can run applications written in any language you want - from Java to R to Haskell. Anything you can run on the host OS can be run inside a container. Containers can also be given strict resource limits for CPU usage, memory, file access, etc. To me, containers seem to be much more like atomic units than J2EE applications.
As an example that I believe many people can relate to, an Application Server can be thought of as your browser, with each tab being an "application". It doesn't happen often, but one tab can crash your entire browser. Docker has been written specifically to avoid this with containers, which is a great thing.
IBM's Design Choices
IBM appears to have chosen this particular pattern in order to make the application as manageable as possible from both perspectives - development AND administration. When upgrading the components of the application, each service/container is basically free to do whatever it wants as long as it continues to adhere to its published REST interface (since REST is the only interface IBM has created for the services).
What does this have to do with DevOps?
DevOps requires frequent building and deploying, ideally in a manner that does not cause any regression test failures. The structure of this application wholeheartedly adheres to this requirement, and it is brilliant.
I'm certain you can think of thousands of ways that this doesn't apply to some application that you deal with, but you should ignore those thoughts when thinking of the future. I truly believe that most, if not all, enterprise-scale applications will be rewritten using either this pattern or one that's extremely similar to it. And everyone in all areas of IT needs to be ready for the new opportunities and challenges that will come with it.
Wednesday, July 19, 2017
IBM Agile Service Manager application maintenance is very easy
The Agile Service Manager team has done an amazing job on installation and upgrade. If you've never managed an enterprise-scale application, the information in this post probably won't impress you much. But really, if you've never managed an enterprise-scale application, you probably quit reading our articles a long, long time ago.
So now that I've got a technical audience, here's the amazing thing:
I just received some updated ASM components from IBM. To install them took TWO COMMANDS:
yum install *.rpm
docker compose up -d
THAT'S IT, and the new components are up and running, with the new functionality. I didn't even have to manually stop or start any processes. It was literally THOSE TWO COMMANDS. This, to me, is absolutely stunning, and hopefully a sign of more good things to come.
Wednesday, July 12, 2017
Using IBM Agile Service Manager and BigFix to obtain and display application communication topology data
Background
We've been working with a client who owns BigFix and Netcool Operations Insight, and who recently purchased the optional Agile Service Manager component of NOI. Up until now, we've been helping this customer obtain communication data (network/port/process connection information) in their environment through BigFix. A valid question you may have is: Doesn't TADDM do that and more? And the answer is yes it does, but the customer has some fairly severe obstacles that prohibit a successful deployment of TADDM.Why are we doing this?
Any Operations group needs as much contextual information as possible to allow them to do their job effectively. Some of the information that Operations teams need is:
- Which systems are communicating with (dependent upon) Server X?
- What processes and applications are running on Server X?
- What is the impact to other systems if we reboot Server X?
etc. There are many, many more questions that come up, and often the best way to answer those questions is with a topology view of the environment. TADDM gives you this topology information, but again, this client is not able to install TADDM, so wanted another way to get similar data.
How are we doing it?
The first challenge was getting the communication information via BigFix. With just a little searching, we realized that this was actually very easy. The 'netstat' command in both Windows and Linux will actually show you information about which ports are owned by/in use by which processes, and then it's just a matter of getting more details about each PID. Linux has the 'ps' command, and Windows PowerShell does too, though the output is different, of course. We also found that PowerShell has a few functions that will directly convert command output into XML. This is important because BigFix includes an XML inspector that lets you report on data that's in an XML file. On Linux, a little Perl scripting was used to accomplish the same goal.So with the IP/port/process information in had, we then needed to display that data in the ASM Topology Viewer. To do that, we used the included File Observer. Specifically, we wrote a script to create the appropriate nodes and edges so that this information can be displayed by ASM.
What's it look like?

Here you can see that a java process on client.gulfsoft.com has opened TCP port 40474 to communicate with a DB2 process listening on port 50000 on db2srv.gulfsoft.com.
Conclusion
Topology data is absolutely crucial to a Operations team for numerous reasons. In this case, we were able to provide this visualization to our client in a very short amount of time (a week or so) while leveraging software they already owned. They now have better insight into their environment and are better prepared to address events in their environment.
Thursday, July 6, 2017
A Windows command similar to awk
I'm always amazed at the capabilities available with built-in Windows command line tools. My latest find is the FOR /F command, documented here:
https://ss64.com/nt/for_cmd.html
My main use for the awk command in *NIX is to pull out some piece of a line of text. I know awk is MUCH more powerful and even has its own robust language, but I've always used it to pull pieces of text out of structured output. And that's what FOR /F does for you. The syntax is completely different, but the capability is there and it's quite powerful.
Friday, June 30, 2017
Now you can get started with Artificial Intelligence on a Raspberry Pi
Microsoft made its AI work on a $10 Raspberry Pi https://www.engadget.com/amp/2017/06/30/microsoft-made-its-ai-work-on-a-10-raspberry-pi/
Thursday, June 29, 2017
More IBM Netcool Agile Service Manager Videos
I think some wires got crossed in YouTube recently as IBM Service Management moved over to the IBM Cloud channel, and it appears that their most recent videos are hidden from any searches. However, thanks to Matt Duggan from IBM who shared the direct links on LinkedIn, I've added them all to my own IBM Agile Service Manager playlist, which can be found here:
https://www.youtube.com/playlist?list=PLxv2WlaeOSG9z_L4LCjHzz-qnZ-vDqnjn
Have fun
https://www.youtube.com/playlist?list=PLxv2WlaeOSG9z_L4LCjHzz-qnZ-vDqnjn
Have fun
Tuesday, June 27, 2017
IBM Netcool Agile Service Manager - What is swagger?
Introduction
The ASM documentation references "swagger" and "swagger URLs" for several different services. The purpose of this post is to describe what this actually means.
What is swagger?
Here's a statement from swagger.io:
The goal of Swagger™ is to define a standard, language-agnostic interface to RESTAPIs which allows both humans and computers to discover and understand the capabilities of the service without access to source code, documentation, or through network traffic inspection.
So the goal of this article is to show what that statement actually means to you in the context of Agile Service Manager.
Swagger URLs for ASM
There are 7 different services that are accessible via a browser. My ASM host is named "asm", and here are the URLs I have for the services:
File Observer Swagger UI
http://asm:9098/1.0/topology/observer/swagger/#/
topology-service Swagger UI
http://asm:8080/1.0/topology/swagger#/
search service Swagger UI
http://asm:7080/1.0/search/swagger
ITNM observer Swagger UI
http://asm:9080/1.0/topology/observer/swagger
OpenStack observer Swagger UI
http://asm:9082/1.0/topology/observer/swagger
Event observer Swagger UI
http://asm:9084/1.0/topology/observer/swagger
Docker observer Swagger UI
http://asm:9086/1.0/topology/observer/swagger
Topology Service
The Topology Service is the one that will be the one you normally want to visit to view (and even change) data about the resources in the ASM database. Here's what you'll see when you access the URL:

You can click on each section to see the operations associated with each. The section I like is Resources. Here are the operations found there:

From here, you can click on one of the operations, such as the first one: GET /resources. Here's just the first part of what's displayed there:

Notice that it gives you documentation about the operation and lots of other information. Specifically, it provides you with the ability to fill in values for all of the parameters that the operation accepts AND allows you to execute the operation! It also provides you with the 'curl' command that you can run from the command line to execute the exact same operation, with the exact same parameters.
The way to execute the operation is to click the "Try it out!" button at the bottom of the operation documentation.

And there you go! Some data. In this case, what's returned is the ID of the node in the topology that matches the criteria I specified. I can then take this ID and use it as input to other operations in this same group or in other groups.
Try it out and have fun
The above is just an short entry point into ASM's swagger UIs. Play around with them and you'll see that you can do some interesting stuff.
Monday, June 26, 2017
Agile Service Manager UI Introduction
Here's a short video introduction covering the basic features of IBM's Netcool Agile Service Manager.
IBM Netcool Agile Service Manager Thoughts
I recently installed IBM's Netcool Agile Service Manager and wanted to give my initial thoughts on it.
Basically, it's a real-time topology viewer for multiple technologies. Specifically, it can currently render topology data for ITNM, OpenStack and Docker, all in one place. Additionally, it maps events to the topology so you can see any events that are affecting a resource in the context of its topology. So, for example, if you receive a CRITICAL event for a particular Docker container, you will see the node representing that container turn red. Pretty neat. Here's an example of a 1-hop topology of my ASM server's docker infrastructure (you always have to start at some resource to view a topology):

Here's a screenshot where I've manually modified the topology using a combination of the File Observer and direct access to the Topology Service REST API (from the Swagger URL):
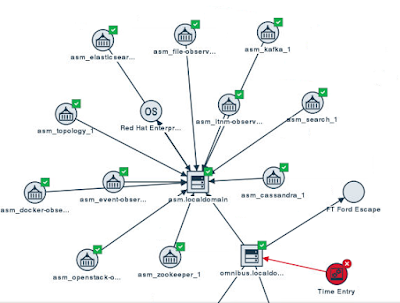
Notice also that Time Entry is in a Critical state. That's due to an event that I generated.
No, ASM is not a complete replacement for TBSM or TADDM, but you can definitely think of it as "TBSM Lite". TBSM still has some very unique features, such as status propagation, service rules, and custom KPIs that can be defined on a per-business-service basis.
And TADDM's unique capability is the hard work of actually discovering very detailed data and relationships in your environment.
However, because the search and visualization pieces of ASM are so fast and efficient, I can definitely see ASM being used as at least part of the visualization portion of TADDM. What would be required to allow this is a TADDM Observer to be written.
Additionally, I think the ASM database and topology will in the future be leveraged by TBSM, though this will take a little work.
What is Agile Service Manager?
Basically, it's a real-time topology viewer for multiple technologies. Specifically, it can currently render topology data for ITNM, OpenStack and Docker, all in one place. Additionally, it maps events to the topology so you can see any events that are affecting a resource in the context of its topology. So, for example, if you receive a CRITICAL event for a particular Docker container, you will see the node representing that container turn red. Pretty neat. Here's an example of a 1-hop topology of my ASM server's docker infrastructure (you always have to start at some resource to view a topology):

What's so great about it?
Combined Topology View
First, this topology view is wonderful for Operations and Development because it shows a topology view of your combined Network, Docker and Openstack environments, so everyone can see where applications are running and the dependencies among the pieces.ElasticSearch
Second, it's got ElasticSearch under the covers, so updates and searches are amazingly fast, and the topology view is built extremely quickly.Custom Topology Information
Third, you can add your own topology information to make it even more useful!Here's a screenshot where I've manually modified the topology using a combination of the File Observer and direct access to the Topology Service REST API (from the Swagger URL):

Notice also that Time Entry is in a Critical state. That's due to an event that I generated.
History
Fourth, it maintains history about the topology. That means that you can view the difference in topology between 2 hours (or two days) ago and right now.Is ASM a complete replacement for TBSM and/or TADDM?
No, ASM is not a complete replacement for TBSM or TADDM, but you can definitely think of it as "TBSM Lite". TBSM still has some very unique features, such as status propagation, service rules, and custom KPIs that can be defined on a per-business-service basis.
And TADDM's unique capability is the hard work of actually discovering very detailed data and relationships in your environment.
However, because the search and visualization pieces of ASM are so fast and efficient, I can definitely see ASM being used as at least part of the visualization portion of TADDM. What would be required to allow this is a TADDM Observer to be written.
Additionally, I think the ASM database and topology will in the future be leveraged by TBSM, though this will take a little work.
Parting thoughts
ASM is a truly useful product, with some great capabilities. It's also incredibly easy to install if you've already got Netcool Operations Insight (or at least DASH) installed - I was able to get it installed in just a few hours. I'm certain IBM will be adding features and add-ons to provide even more functionality in the coming months.
Thursday, May 25, 2017
New Linux Samba vulnerability and fix
A new vulnerability was found in Linux Samba from version 3.5 and above. Details here:
https://www.samba.org/samba/security/CVE-2017-7494.html
The workaround is easy and is contained in the link above:
in your /etc/samba/smb.conf file, add the following in the [global] section:
https://www.samba.org/samba/security/CVE-2017-7494.html
The workaround is easy and is contained in the link above:
in your /etc/samba/smb.conf file, add the following in the [global] section:
nt pipe support = no
Then restart smbd with 'service smb restart'
Monday, April 24, 2017
BMXAA7025E and BMXAA8313E Errors running MAXINST on ICD 7.6
I wanted to install the demo data that's provided with ICD 76 by basically following the instructions found here:
https://www.ibm.com/developerworks/community/wikis/home?lang=en#!/wiki/Anything%20about%20Tivoli/page/To%20load%20the%20sample%20DB2%20database%20after%20Control%20Desk%207.6%20installed
But I didn't find those steps before I started, so I took my own path.
Specifically, I didn't drop the database, and that meant that I encountered errors BMXAA7025E and BMXAA8313E when running the 'maxinst.sh' script. What I found is that the cleandb operation doesn't really delete all of the tables and views in the MAXIMO schema (I'm on DB2/WebSphere/RHEL 6.5), so when maxinst gets to running the files under:
/opt/IBM/SMP/maximo/tools/maximo/en/dis_cms
It fails because a few of these SQL files try to create tables and views that still exist. I found this link about the problem:
https://www-01.ibm.com/support/docview.wss?uid=swg21647350
But I didn't like it because it tells you to re-create the database. So with a little digging, I found that after I hit the error, I could run the following db2 commands to delete all of the tables and views that were not automatically deleted:
db2 connect to maxdb76 user maximo using passw0rd
db2 DROP TABLE ALIASES
db2 DROP TABLE ATTRIBUTE_TYPES
db2 DROP TABLE BNDLVALS
db2 DROP TABLE BUNDLENM
db2 DROP TABLE CDM_VERSION
db2 DROP TABLE CHANGE_EVENTS
db2 DROP TABLE CLASS_TYPES
db2 DROP TABLE CMSTREE
db2 DROP TABLE CMSTREES
db2 DROP TABLE DESIRED_SUPPORTED_ATTRS
db2 DROP TABLE DESIRED_SUPPORTED_MAP
db2 DROP TABLE ENUMERATIONS
db2 DROP TABLE FTEXPRSN
db2 DROP TABLE FTVALUES
db2 DROP TABLE INTERFACE_TYPES
db2 DROP TABLE LAPARAMS
db2 DROP TABLE LCHENTR
db2 DROP TABLE LCHENTRY
db2 DROP TABLE ME_ATTRIBUTES
db2 DROP TABLE METADATA_ASSN
db2 DROP TABLE MSS
db2 DROP TABLE MSS_ME
db2 DROP TABLE MSS_RELATIONSHIPS
db2 DROP TABLE NAMING_IDENTIFIERS
db2 DROP TABLE NAMING_POLICIES
db2 DROP TABLE NAMING_RULES
db2 DROP TABLE RELATIONSHIPS
db2 DROP TABLE RELATIONSHIP_TYPES
db2 DROP TABLE SBSTVALS
db2 DROP TABLE SUPERIORS
db2 DROP TABLE VALID_REL_TYPES
db2 DROP VIEW ATTR_PRIORITIES
db2 commit
And then I could re-run the maxinst.sh script and it worked like a champ. Please feel free to use my super secure password for yourself.
Monday, April 3, 2017
DevOps: Operations Can't Fail
Agile and DevOps are all about "Fail Fast", which is fine for developers, but absolutely unacceptable for Operations.
For a recent example, just look at the recent AWS outage:
http://www.recode.net/2017/3/2/14792636/amazon-aws-internet-outage-cause-human-error-incorrect-command
That was caused by someone debugging an application. None of us want our Operations department to be in that position, but it can obviously happen. I think there are one or more reasons behind why it happened, and I've got some opinions on how we need to work to ensure it doesn't happen to us:
Problem: Developers think Operations is easy
Absolutely everything labeled "DevOps" is aimed at allowing Development to do just enough "operations" to get by. But we in Operations know that it takes a lot more: Change and Configuration Management, Event Management, Business Service Modeling, and the list goes on and on. Individual Development teams don't necessarily understand these practices outside of their own application.
One Solution: We need to learn about "the new stuff"
The only way we'll be invited to the table to talk to development teams is to learn about the tools they're using (Jira, Puppet/Chef, Kubernetes, Docker, etc.). This will allow us to use a similar vocabulary when meeting with them. Without this basic knowledge, they simply won't invite us to any of their discussions.
Problem: Developers think Operations is unnecessary
Individual Development teams often don't see why the Operations department even exists. They have their tools that allow them to consistently deploy their application, so why does Operations need to be involved. They don't understand that any one of their 20-or-so "incidental" microservices may actually be absolutely critical to some other application in the environment.
One Solution: After learning the new stuff, ask to be involved
The Operations Manager needs to get involved with the Development teams. She needs to give Development teams some type of framework or process or SOMETHING that makes their application's metrics and availability visible to the Enterprise. This will allow ALL involved parties to understand the situation when there is an outage.
A great graphic from Ingo Averdunk at IBM

The parts in light blue (Logging, Monitoring, Event Mgmt, Notification, Runbook Automation, ChatOps and Root Cause Analysis) are those components that need to be standardized across all applications. If your Operations team isn't meeting with Development, you won't get to explain the need for the standard suite of tools.
There are other problems and other solutions
This post is meant to help Operations in a sea of DevOps information that is aimed only at Development, in the hope that we can reign things in and continue to ensure that the entire enterprise is healthy and available.
Friday, March 31, 2017
DevOps: The functions that must be standardized among different applications
DevOps appears to be here to stay, so from an Operations perspective, we need to ensure that all of the Development teams are playing together nicely and following some common rules.
Why?
I just realized that many Dev teams don't fully understand the need for Ops when they're implementing DevOps. Here are the foundational reason, IMO, behind the need for Operations:
Business Continuity
In many enterprises, applications never die, and customers continue to need support long after the original application development team has moved on. If applications don't follow some basic standard practices, they can easily be forgotten by the people who need to support them - Operations. Developers want to move on to the next new thing, which is great for Dev, but horrible for Ops. There are numerous classifications of applications that can't simply change on a whim due to factors such as regulatory control. Regulations affect a truly stunning number of companies, from utilities to taxis to manufacturing. Unless Dev is going to take responsibility for the support of their application over its entire lifespan (which can be 5 to even 20 years), Operations needs to be involved.
Integration With Other Applications
Applications need to talk to one another at some point. And when those connections fail, all involved application teams usually point fingers at one another. To minimize this finger-pointing, all applications should adhere to some common standards, several categories of which are found below. Even if all Development teams coordinate tightly in your company, there are still MANY external applications being used that need to be supported (e.g. WebSphere, Oracle, etc.). And the management of these applications needs to be coordinated with the in-house applications being built. Operations provides this management and coordination.
Logging
Application logging should be somewhat standardized to allow the log data to be collected and parsed for important information. This doesn't mean they all need to log in exactly the same format, but they should all adhere to some best practices, such as:
Every log entry should have a timestamp and a unique identifier (such as transaction ID)
Logs should be human readable
Identify the source of the message
Avoid multi-line messages if possible
Use name-value pairs (possibly log in JSON format)
Monitoring
Applications NEED to be monitored at very least for performance (response time) and availability (up/down). Ideally you want to have data collectors at each tier of a multi-tiered application to give you transaction topology and detailed monitoring data, but this can come later. At a bare minimum, all applications need to be monitored using some type of synthetic transactions, which run dummy/non-"real" transactions through the system to gather constant performance and availability metrics.
Event Management
While many applications log information, there are parts of the infrastructure that can only send "events" to some remote destination. The most common types of events are "SNMP traps" (SNMP=Simple Network Management Protocol), which are generated by network equipment such as routers and switches. A cohesive management strategy by operations needs to manage information in log files and events to allow for correlation between and among different systems. For example, a JDBC call from an application may fail, but the application itself doesn't know if this is a failure of the database itself, the network infrastructure or possibly even DNS misconfiguration. The event management function of the Operations group works on identifying these relationships in order to help perform Root Cause Analysis of incidents. This decreases the amount of resources required to resolve an issue.
Notification
Who needs to be notified when "something" goes wrong? Do you want every application team to receive an emergency text in the middle of the night for every problem? Probably not. The Operations team is usually responsible for sending (and, more importantly, suppressing) the appropriate notifications. This is tightly related to Event Management and Root Cause Analysis.
Runbook Automation
Anyone who is responsible for handling a ticket needs to have some idea of what to do. Runbooks are sequences of steps an operator can run to gather more information and/or resolve an issue. Runbooks need to be maintained to ensure that they're valid and up-to-date. Application teams often don't have all of the experience needed to create comprehensive runbooks. They are created over time by the Operations staff, who are constantly handling issues.
Authentication
In an enterprise, the ideal situation is that each user has ONE userid and password (or certificate, etc.) that they use to authenticate to all applications. This authentication storage mechanism needs to be maintained. This is another function provided by Operations.
Conclusion
DevOps is currently a very popular methodology, and it serves its purpose very well. It allows Development teams to continuously deploy applications to provide better business value. Operations is still required to perform quite a few functions that simply aren't in the purview of Development.
Monday, March 20, 2017
Come by booth 568 at #IBMInterConnect to demystify DevOps from an Operations perspective
There is a LOT of chatter about DevOps, but all of it seems to leave Operations almost completely out of the picture. Come to our booth to get our take on DevOps including:
- DevOps tries to encourage Development to do *some* amount of automation and monitoring.
- Your Operations department needs to provide Dev teams with policies for integrating their apps into your monitoring and event management system.
- Your Operations department needs to learn a little about software development so you can help educate your Enterprise on exactly how DevOps can fit into your environment.
- Your Operations department needs to learn enough about Agile (specifically Scrum and Kanban) to participate in relevant conversations when the topics arise.
- and more.
Saturday, March 18, 2017
We're heading to #IBMInterConnect in Vegas
We'll see you there! We're in booth 568 in the Hybrid Cloud area.
Thursday, February 23, 2017
Visit us at booth 568 at IBM InterConnect March 19-23 in Las Vegas
Get out to IBM InterConnect 2017!
Stop by booth S568 in the Hybrid Cloud area to talk to us about:
- Our recent and historical successes helping customers like you deploy IBM products.
- IBM's comprehensive suite of ITSM tools, including Netcool, IBM Control Desk, IBM Performance Management, and TADDM.
- How you can effectively use an Agile methodology in your journey to realizing DevOps.
- Different strategies for effective deployments.
- Effectively consolidating and integrating your existing toolsets to your best advantage.
and many more topics!
Thursday, February 9, 2017
How to start a Netcool OMNIbus implementation
Someone posed this question on IBM Developerworks today, and I wanted to share the answer I provided, since it contains quite a few useful links:
https://www.ibm.com/mysupport/s/question/0D50z00006LMPab/how-to-start-implementation-of-tivoli-omnibus?language=en_US
https://www.ibm.com/mysupport/s/question/0D50z00006LMPab/how-to-start-implementation-of-tivoli-omnibus?language=en_US
And here's my reply in case the above link goes away:
With such an open-ended question, I'm going to provide links that start at the very beginning - Event Management. IBM has a great Redbook on this topic. It's from 2004, but the foundational information is still completely valid:
http://www.redbooks.ibm.com/redbooks/pdfs/sg246094.pdf
It's a REALLY good reference, particularly chapters 1 and 2. Once you understand Event Management concepts, reasons, challenges, needs and personas, I think you then need to move on to information about the OMNIbus components, architecture and capabilities, which you can find in the product documentation here:
Then keep on reading through the rest of the product documentation so you understand how OMNIbus is basically configured.
The next topic you'll want to look at is probes. which will process data and send events to OMNIbus, and this information is also in the product documentation:
Next you'll probably want to dive into ObjectServer SQL to find out how to manage the events that probes generate:
You should probably also look at the links listed here:
https://www.ibm.com/developerworks/community/wikis/home?lang=en
Somewhere in here, you'll also need to determine if you're going to use Netcool Impact (most new customers purchase both products in some combination). And if so, you start poking around the Impact Wiki:
https://www.ibm.com/developerworks/community/wikis/home?lang=en
Automated testing for IBM Control Desk
Last year IBM made available the Selenium Automation Toolkit for Maximo, which includes IBM Control Desk. More information can be found here:
https://www.ibm.com/developerworks/community/forums/html/topic?id=4d90a532-31a3-41bd-a128-2186fdae50b8
More information about Selenium itself can be found here:
http://www.seleniumhq.org/
IBM uses Selenium in several tools, including IBM Performance Manager and IBM Application Performance Manager. Essentially, it's used for recording and playing back web browser interactions.
Thursday, January 5, 2017
Maximo: How to view data from an arbitrary table
I recently had a need to view data in a Maximo table, but didn't have direct access to the database. So I wanted to find a way to use the Maximo Application Developer to get me this data. As I thought, it's very straightforward. Basically, you just need to create, configure, authorize and launch a dialog that specifies the table (MBO) as its source.
Mainly, follow the thorough instructions found here:
http://maximobase.blogspot.com/2013/05/how-to-create-custom-dialog-box-in.html
The parts of interest are:
In the dialog element, specify the appropriate mboname:
<dialog id="Testing" mboname="WARRANTYVIEW" label="Contract financial info" >
In this example, the MBO is "WARRANTYVIEW".
Also, you need to specify your MBO's attributes in with the "dataatribute" attribute of each appropriate control:
<textbox id="finaninfo_grid_s1_1"dataattribute="totalcost" />
In this case, "totalcost" is the name of the attribute that will be displayed. Yours will be different.
And that's it for my usecase. The MBO used by the dialog doesn't have to have any relationship to the main MBO attached to the application.
Subscribe to:
Posts (Atom)