The following is from an IBM Communities post on this topic by Detlef Kleinfelder . The link is also included, but those see to go dead on IBM's site, which is why I'm including the text:
Saturday, September 30, 2023
Thursday, September 14, 2023
Configuring DASH/JazzSM and WebGUI HA using an ObjectServer database
There is a great support article on this exact topic here:
There are just a few caveats that need I need to point out:
1. Use the webha.sql file from the above link to create the ObjectServer database. There are two similar files on your DASH/JazzSM server after the install, but both are incorrect.
2. The instructions in the link for configuring WebSphere are all manual, through the WebSphere Admin Console. To make things more easily repeatable, I created a file with all of the Jython WebSphere administrative commands required. Here are the contents of that file:
Friday, August 25, 2023
Modifying the Netcool Remedy 8 gateway for use with Java JDK 8
𝐁𝐚𝐜𝐤𝐠𝐫𝐨𝐮𝐧𝐝
The Netcool Gateway for Remedy 8 version 1.3 was originally written for Java 6, which used the Rhino JavaScript engine. The Nashorn JavaScript engine in Java 8 (which is automatically installed with an OMNIbus fixpack) is slightly different. Nashorn is so different that the some modifications are required to get the probe to work correctly.The error you'll see in the gateway log file if you try to run the gateway without these changes is:
Error: [Main Gateway] java.lang.RuntimeException: javax.script.ScriptException: ReferenceError: "importPackage" is not defined in <eval> at line number 1
The issue is basically that Nashorn gives you a new way to create Java objects within JavaScript.
𝐒𝐨𝐥𝐮𝐭𝐢𝐨𝐧
You will need to modify three files to get the Remedy 8 gateway working correctly. Those files are listed here:
$𝗢𝗠𝗡𝗜𝗛𝗢𝗠𝗘/𝗷𝗮𝘃𝗮𝘀𝗰𝗿𝗶𝗽𝘁/𝗺𝗼𝗱𝘂𝗹𝗲𝘀/𝘀𝗼𝗴.𝗷𝘀
$𝗢𝗠𝗡𝗜𝗛𝗢𝗠𝗘/𝗷𝗮𝘃𝗮𝘀𝗰𝗿𝗶𝗽𝘁/𝗺𝗼𝗱𝘂𝗹𝗲𝘀/𝗱𝗮𝘁𝗲𝗳𝗼𝗿𝗺𝗮𝘁.𝗷𝘀
In the above two files, you simply need to add this one line at the beginning of each file:
𝚕𝚘𝚊𝚍("𝚗𝚊𝚜𝚑𝚘𝚛𝚗:𝚖𝚘𝚣𝚒𝚕𝚕𝚊_𝚌𝚘𝚖𝚙𝚊𝚝.𝚓𝚜");
$𝗢𝗠𝗡𝗜𝗛𝗢𝗠𝗘/𝗴𝗮𝘁𝗲𝘀/𝗯𝗺𝗰_𝗿𝗲𝗺𝗲𝗱𝘆/𝗯𝗺𝗰_𝗿𝗲𝗺𝗲𝗱𝘆.𝗻𝗼𝘁𝗶𝗳𝗶𝗰𝗮𝘁𝗶𝗼𝗻.𝗷𝘀
This file requires a bit more customization. Specifically, you replce this line in the update() function definition:
𝚟𝚊𝚕𝚞𝚎𝚜 = 𝚜𝚘𝚐.𝚗𝚎𝚠𝚛𝚘𝚠();
With these 3 lines:
//𝚟𝚊𝚕𝚞𝚎𝚜 = 𝚜𝚘𝚐.𝚗𝚎𝚠𝚛𝚘𝚠(); // 𝚓𝚞𝚜𝚝 𝚌𝚘𝚖𝚖𝚎𝚗𝚝𝚒𝚗𝚐 𝚒𝚝 𝚘𝚞𝚝.
𝚟𝚊𝚛 𝚂𝙾𝙶𝚁𝚘𝚠 = 𝙹𝚊𝚟𝚊.𝚝𝚢𝚙𝚎("𝚌𝚘𝚖.𝚒𝚋𝚖.𝚝𝚒𝚟𝚘𝚕𝚒.𝚗𝚎𝚝𝚌𝚘𝚘𝚕.𝚒𝚗𝚝𝚎𝚐𝚛𝚊𝚝𝚒𝚘𝚗𝚜.𝚜𝚘𝚐.𝚂𝙾𝙶𝚁𝚘𝚠");
𝚟𝚊𝚛 𝚟𝚊𝚕𝚞𝚎𝚜 = 𝚗𝚎𝚠 𝚂𝙾𝙶𝚁𝚘𝚠();
Once you make all of the above changes, you need to restart the gateway for the changes to take effect, and it has a better chance of working. I say better chance because you still have to provide all of the correct values for the various properties. But if you're just upgrading your working gateway to OMNIbus 8.1 FixPack 30, then the above changes are what you need.
Friday, August 18, 2023
Updating the bundled Java SDK 8 in WebSphere 8.5.5.x
There are a couple different ways to install Java with WebSphere. The most common way is to simply use the bundled Java SDK. Even with this, sometimes you need to update the Java SDK outside of a Fix Pack. To do that, you need to download an update specifically for the bundled Java SDK. Those can be found here:
https://www.ibm.com/support/pages/node/6209712#Java8B
You can download the appropriate version, unzip it, add it as a repository to Installation Manager, and then click "Update" to update the WAS bundled JVM.
An example scenario is this:
I have a customer with WAS 8.5.5.11 installed in a secure and regulated environment. They were told they needed to install WAS 8.5.5 FP 23 (FP24 is available, but it has not yet been approved for installation in this environment) and Java 8.0.8.5. WAS 8.5.5.23 comes bundled with Java 8.0.7.20. So we needed to apply the 8.5.5.23 Update via Installation Manager, and then apply the Bundled Java SDK 8.0.8.5 Update via Installation Manager, and all was good.
Thursday, August 17, 2023
Upgrading from IBM Installation Manager 1.8.x to 1.9.x
This is a little tricky because both the documentation and the error message you receive when you try to follow the documentation both lead you in the wrong direction if you currently have IIM installed in "Group mode".
Specifically, the docs tell
you to add the new IIM repository.config as a repository to your current IIM 1.8.x installation and to click
Update. However, when you do that, it fails and tells you to run the "userinst" command from the new version.
This is the correct command to run IF you initially installed IIM in "User mode". But if you originally
installed in Group mode, you need to run the "groupinst" command instead.
When you do run "groupinst"
(or "userinst" or "install" if you installed it originally in "Admin mode") from the new IIM, you need to make
sure to specify the same Data location as you previously used. It will simply use the default value by default,
so you need to explicitly state the correct location. ADDITIONALLY, if you specified a custom data location on
your original install, you need to copy the InstallationManager.dat file from under that location (run a
'find' to find it) to this location :
/home/your_user/var/ibm/InstallationManager_Group/etc/.ibm/registry/InstallationManager.dat
This is the default location
that IIM looks in for the file. If you don't copy this file over, it will tell you that there's an inconsistency
in your install. Here's the error you'll see:
The
Installation Manager's registry information is inconsistent with its installation information.
The registry
information at "/home/netcool/var/ibm/InstallationManager_Group/etc/.ibm/registry/Installationmanager.dat"
indicates that the Installation manager is not installed. however. the information at the
"/opt/IBM/InstallationManager/IM/var/ibm/InstallationManager_group" data location indicates that Installation
manager 1.8.9 (internal version: 1.8.9000.20180313_1417) is installed at location
"/opt/IBM/InstallationManager/IM/InstallationManager_Group/eclipse".
Copy the
file over, and you'll no longer get the error.
Also, as a
handy piece of information, that file contains the Data Location, specified on the "appDataLocation="
line.
Thursday, July 13, 2023
Securing the Netcool EWS Probe
Background
The Netcool Probe for Microsoft Exchange Web Services (EWS Probe) documentation leads you to create the probe with a very large security issue. Specifically, following the IBM documentation, the probe is allowed to access ANY mailbox just by specifying the name of the mailbox (email address) WITH NO PASSWORD. That is not ideal.
Solution
My client and I contacted IBM support and got the following solution really quickly (within just a couple of hours):
The steps are taken from this link https://docs.microsoft.com/en-us/graph/auth-limit-mailbox-access.
Due to security concerns highlighted by customer, A Doc APAR to add the following steps into probe guide has been raised.
APAR number : IJ41418
Limiting probe access to specific Exchange Online mailboxes.
By default OAuth authentication enables the probe to access all mailboxes in an organization on Exchange Online. Administrators can identify the set of mailboxes to permit access by putting them in a mail-enabled security group. Administrators can then limit probe access to only that set of mailboxes by creating an application access policy for access to that group.
a. Create a new mail-enabled security group using steps in this link or use an existing one and identify the email address for the group.
b. Add the user of mailbox to be accessed by probe into the group.
c. Connect to Exchange Online PowerShell. For details, see Connect to Exchange Online PowerShell.
d. Create an access policy on the registered Azure Active Directory application.
New-ApplicationAccessPolicy -AppId <<Application/ClientID>> -PolicyScopeGroupId <<SecGroupEmail>> -AccessRight RestrictAccess -Description "IBM Netcool EWS Probe Mailbox"
Tuesday, April 18, 2023
Configuring the Prometheus JSON Exporter to Parse a JSON Array
Background
The Prometheus JSON Exporter allows you to parse arbitrary JSON data into Prometheus metrics. You'll even find some examples at the link. The problem is that all of the examples show a single JSON object. What is the syntax supposed to be if you're dealing with JSON that is an array, like this data? This question came up on Reddit.
Solution
The solution is to specify the path as:
path: '{[*]}'
That's it. That will return the entire array as a list, which is what's needed to have the JSON Exporter loop through it.
Here's a link to the github gist with more details about how you can use the above information.
Monday, April 10, 2023
I bet you don't fully understand the power of a CI/CD pipeline
If your team is delivering something digital, you MUST use a CI/CD pipeline.
I'm sure you've heard of CI/CD (Continuous Integration/Continuous Development) pipelines, but I bet a lot of you don't truly understand how powerful they can be. Before the other day, I basically understood their power, but then I submitted my first Pull Request to a huge open source project and was simply blown away. A Pull Request (I hate the name because the words don't make sense to me, but that's the name) is a mechanism for a developer/contributor to notify team members that they have completed a feature or change. So it's really a request to merge a change into the code base.
In my case, I was reading the Grafana Agent documentation and saw an error that bugged me. There was an incorrect statement in the technical description. The wrong label was specified. I've run across this type of error in numerous vendor documents, so I'm used to it, but ti still gets me every time I come across one. The difference here was that the error was close to the bottom of the page, and at the bottom was this group of links:
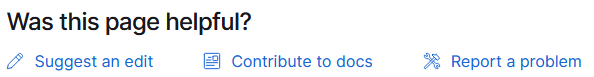
So I clicked on "Suggest an edit" and was taken to the Github repository storing the docs. I already had an account, so I made the small change I needed, and it automatically created a new branch for me with the change and prompted me to make a Pull Request. So I did that, and it let me know that the first issue was that I needed to sign the Contributor License Agreement, and it provided a link to that. I signed the agreement, and the pull request automatically got put into a "Needs Review" state and was assigned to one of the maintainers. So I figured "Well, I did something good. Maybe that update will show up on the website one day, eventually". A couple of hours later I got an email stating that my pull request was reviewed, approved, and merged into the main trunk. So I figured I would check the Grafana Agent page for grins, AND MY CHANGE WAS THERE, LIVE ON THE SITE!
Now for my "bigger picture" opinion on this:
In working with large software vendors, I have made similar change requests that took me hours to complete and that were NEVER implemented in the product documentation, so I was completely amazed. After going through this process, it is my strong opinion that any company that provides documentation for their products should have a publicly available repository that allows public contributions. I realize that the legalese for any particular Contributor License Agreement would need to be ironed out, along with many other details. Or there could be a restriction that updates are allowed only by Business Partners (who have already signed numberous documents). My point is that a huge number of extremely useful updates could be crowdsourced in this way.
Thursday, March 30, 2023
Sending Kibana (free/open source) Alerts via Webhook Using Fluent-Bit (free)

Background
This is a case where we helped a customer save quite a bit of money by using software they already owned rather than paying a large upcharge for additional licenses that they didn't need.
For any number of good reasons, your use case only calls for the free version of Elastic in your environment. In your environment, you also want to integrate alerts with your ticketing system. The challenge is that the free version of Kibana does not include a webhook connector for alerts. Only the Server log connector is available with the free license, whereas the Webhook connector (and others) are only available with the paid licenses.
I have a customer in the above situation. An application they purchased is bundled in an appliance running a packaged Kubernetes distribution. The application also includes Fluent Bit for log collection into Elasticsearch. The initial challenge was to send alerts to their on-prem Netcool environment when certain log messages were written. We helped them meet this challenge using the webhook output of Fluent Bit to send the appropriate messages to the Netcool message bus probe, which would then create an incident in their ticketing system for each of these alerts.
Their next requirement was to only create incidents based on some aggregation of log messages. Specifically, they obtained several Elasticsearch queries from the vendor that should be used to generate incidents. This is really straightforward when using one of the paid Elastic licenses because you can simply write a rule with the Elasticsearch query as a condition and the built-in webhook connector to define an action that sends a message. With the free license of Kibana, that connector isn't available.
My Solution
The trick to the solution in this case is to just use the Server Log connector in Kibana to write a specifically-formatted message to the log when the Elasticsearch query condition is met. The message can be similar to:
CREATE_INCIDENT Vendor Query X has breached the prescribed threshold. Take action Y to correct.
This message is written to the log file for the Kibana pod, which is already being tail'ed by Fluent Bit. So we just needed to create a FILTER in Fluent Bit to match this log message and route that to the message bus probe.
Wednesday, March 29, 2023
Tunneling X11 over SSH as a different user
Background
X11 tunneling over SSH is pretty straightforward as long as you don't need to su to another user on the target system. When you have to do that, it gets a little tricky, and that's the reason for this post.
Solution
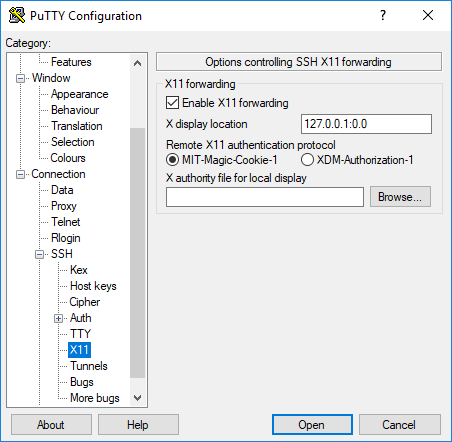
In my case, I'm usually starting the process from a Windows server with Putty, so that's the basis for this solution. I have tested this with both xming and Moba Xterm on Windows. So before connecting to a remove server, make sure that your Windows X server is running and Putty is configured to allow X11 forwarding:
Ensure X11 tunneling is configured for your session:
Open the session (connect to the remove system) and ensure that your xauth exists and your local display is set so you can get your MIT-MAGIC-COOKIE:
[franktate@linux1 ~]$ echo $DISPLAY
localhost:10.0
[franktate@linux1 ~]$ xauth list | grep :10
linux1.gulfsoft.com/unix:10 MIT-MAGIC-COOKIE-1 a229706ccb496af61501ea25a95488
[franktate@linux1 ~]$
Note how your display number is used to identify the appropriate MIT-MAGIC-COOKIE
Ensure that an X application can connect to your Windows X server by running xterm or some other application.
Switch users and set the MIT-MAGIC-COOKIE:
[franktate@linux1 ~]$ su - db2inst1
Password:
-bash: TMOUT: readonly variable
[db2inst1@linux1 ~]$ xauth add linux1.gulfsoft.com/unix:10 MIT-MAGIC-COOKIE-1 a229706ccb496af61501ea25a95488
[db2inst1@linux1 ~]$
Run xterm or some other X application to be sure X is tunneled correctly. Assuming that works, now connect from the first machine to another.
SSH to the next hop host and get your MIT-MAGIC-COOKIE
[db2inst1@linux1 ~]$ ssh -Y frank2@linux2
frank2@linux2's password:
Last failed login: Sat Feb 23 16:17:29 EST 2019 on pts/0
[frank2@linux2 ~]$ echo $DISPLAY
localhost:10.0
[frank2@linux2 ~]$ xauth list | grep :10
linux2.gulfsoft.com/unix:10 MIT-MAGIC-COOKIE-1 2d31b43034bfc9da1c0d2848c1b718
[frank2@linux2 ~]$
Run xterm or some other X application to be sure X is tunneled correctly.
Switch users and set the MIT-MAGIC-COOKIE
[frank2@linux2 ~]$ su - db2inst1
Password:
[db2inst1@linux2 ~]$ xauth add linux2.gulfsoft.com/unix:10 MIT-MAGIC-COOKIE-1 2d31b43034bfc9da1c0d2848c1b718
Run an X application like xterm to validate that it's working.
Subscribe to:
Posts (Atom)