Monday, April 10, 2023

I bet you don't fully understand the power of a CI/CD pipeline

If your team is delivering something digital, you MUST use a CI/CD pipeline. 

I'm sure you've heard of CI/CD (Continuous Integration/Continuous Development) pipelines, but I bet a lot of you don't truly understand how powerful they can be. Before the other day, I basically understood their power, but then I submitted my first Pull Request to a huge open source project and was simply blown away. A Pull Request (I hate the name because the words don't make sense to me, but that's the name) is a mechanism for a developer/contributor to notify team members that they have completed a feature or change. So it's really a request to merge a change into the code base. 

In my case, I was reading the Grafana Agent documentation and saw an error that bugged me. There was an incorrect statement in the technical description. The wrong label was specified. I've run across this type of error in numerous vendor documents, so I'm used to it, but ti still gets me every time I come across one. The difference here was that the error was close to the bottom of the page, and at the bottom was this group of links:


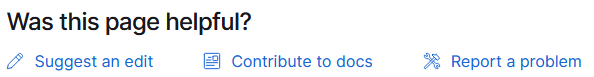
So I clicked on "Suggest an edit" and was taken to the Github repository storing the docs. I already had an account, so I made the small change I needed, and it automatically created a new branch for me with the change and prompted me to make a Pull Request. So I did that, and it let me know that the first issue was that I needed to sign the Contributor License Agreement, and it provided a link to that. I signed the agreement, and the pull request automatically got put into a "Needs Review" state and was assigned to one of the maintainers. So I figured "Well, I did something good. Maybe that update will show up on the website one day, eventually". A couple of hours later I got an email stating that my pull request was reviewed, approved, and merged into the main trunk. So I figured I would check the Grafana Agent page for grins, AND MY CHANGE WAS THERE, LIVE ON THE SITE!

Now for my "bigger picture" opinion on this:

In working with large software vendors, I have made similar change requests that took me hours to complete and that were NEVER implemented in the product documentation, so I was completely amazed. After going through this process, it is my strong opinion that any company that provides documentation for their products should have a publicly available repository that allows public contributions. I realize that the legalese for any particular Contributor License Agreement would need to be ironed out, along with many other details. Or there could be a restriction that updates are allowed only by Business Partners (who have already signed numberous documents). My point is that a huge number of extremely useful updates could be crowdsourced in this way.


Thursday, March 30, 2023

Sending Kibana (free/open source) Alerts via Webhook Using Fluent-Bit (free)


Background

This is a case where we helped a customer save quite a bit of money by using software they already owned rather than paying a large upcharge for additional licenses that they didn't need.

For any number of good reasons, your use case only calls for the free version of Elastic in your environment. In your environment, you also want to integrate alerts with your ticketing system. The challenge is that the free version of Kibana does not include a webhook connector for alerts. Only the Server log connector is available with the free license, whereas the Webhook connector (and others) are only available with the paid licenses.

I have a customer in the above situation. An application they purchased is bundled in an appliance running a packaged Kubernetes distribution. The application also includes Fluent Bit for log collection into Elasticsearch. The initial challenge was to send alerts to their on-prem Netcool environment when certain log messages were written. We helped them meet this challenge using the webhook output of Fluent Bit to send the appropriate messages to the Netcool message bus probe, which would then create an incident in their ticketing system for each of these alerts.

Their next requirement was to only create incidents based on some aggregation of log messages. Specifically, they obtained several Elasticsearch queries from the vendor that should be used to generate incidents. This is really straightforward when using one of the paid Elastic licenses because you can simply write a rule with the Elasticsearch query as a condition and the built-in webhook connector to define an action that sends a message. With the free license of Kibana, that connector isn't available. 

My Solution

The trick to the solution in this case is to just use the Server Log connector in Kibana to write a specifically-formatted message to the log when the Elasticsearch query condition is met. The message can be similar to:

CREATE_INCIDENT Vendor Query X has breached the prescribed threshold. Take action Y to correct.

This message is written to the log file for the Kibana pod, which is already being tail'ed by Fluent Bit. So we just needed to create a FILTER in Fluent Bit to match this log message and route that to the message bus probe. 

Wednesday, March 29, 2023

Tunneling X11 over SSH as a different user

Background

X11 tunneling over SSH is pretty straightforward as long as you don't need to su to another user on the target system. When you have to do that, it gets a little tricky, and that's the reason for this post.

Solution

In my case, I'm usually starting the process from a Windows server with Putty, so that's the basis for this solution. I have tested this with both xming and Moba Xterm on Windows. So before connecting to a remove server, make sure that your Windows X server is running and Putty is configured to allow X11 forwarding:

Ensure X11 tunneling is configured for your session:


Open the session (connect to the remove system) and ensure that your xauth exists and your local display is set so you can get your MIT-MAGIC-COOKIE:

[franktate@linux1 ~]$ echo $DISPLAY

localhost:10.0

[franktate@linux1 ~]$ xauth list | grep :10

linux1.gulfsoft.com/unix:10  MIT-MAGIC-COOKIE-1  a229706ccb496af61501ea25a9548851

[franktate@linux1 ~]$


Note how your display number is used to identify the appropriate MIT-MAGIC-COOKIE


Ensure that an X application can connect to your Windows X server by running xterm or some other application.

Switch users and set the MIT-MAGIC-COOKIE:

[franktate@linux1 ~]$ su - db2inst1

Password:

-bash: TMOUT: readonly variable

[db2inst1@linux1 ~]$ xauth add linux1.gulfsoft.com/unix:10  MIT-MAGIC-COOKIE-1  a229706ccb496af61501ea25a9548851

[db2inst1@linux1 ~]$


Run xterm or some other X application to be sure X is tunneled correctly. Assuming that works, now connect from the first machine to another.


SSH to the next hop host  and get your MIT-MAGIC-COOKIE


[db2inst1@linux1 ~]$ ssh -Y frank2@linux2

frank2@linux2's password:

Last failed login: Sat Feb 23 16:17:29 EST 2019 on pts/0


[frank2@linux2 ~]$ echo $DISPLAY

localhost:10.0

[frank2@linux2 ~]$ xauth list | grep :10

linux2.gulfsoft.com/unix:10  MIT-MAGIC-COOKIE-1  2d31b43034bfc9da1c0d2848c1b718d8

[frank2@linux2 ~]$


Run xterm or some other X application to be sure X is tunneled correctly.


Switch users and set the MIT-MAGIC-COOKIE


[frank2@linux2 ~]$ su - db2inst1

Password:

[db2inst1@linux2 ~]$ xauth add linux2.gulfsoft.com/unix:10  MIT-MAGIC-COOKIE-1  2d31b43034bfc9da1c0d2848c1b718d8


Run an X application like xterm to validate that it's working.


Modify kibana.yml after deploying Kibana with Helm

If you deploy Kibana using the Elastic helm chart with default values, what you'll find is that you don't have any obvious way to modify the kibana.yml file. For example, if you log into the Kibana pod with

kubectl exec --stdin --tty kibana_podname -- /bin/bash

you'll find that there's no editor available (like vi or even ed). You can cat config/kibana.yml, but the comments state that it is auto-generated. So what are you supposed to do to add an a setting to the file? For example, you might need to add a value for xpack.encryptedSavedObjects.encryptionKey so you can configure alerting.

The solution I came up with is a multi-step process:

1. Get the default values.yaml file for the chart and store that in a file with the command:

helm show values elastic/kibana > /tmp/kibana.yaml

2. Edit that file to add a section for kibana.yml under kibanaConfig. Originally, kibanaConfig is empty (set to {}). You need to change it to be something like:

kibanaConfig:
   kibana.yml: |
      xpack.encryptedSaveObject.encryptionKey xxxxxxxxxxxxxxxxxxxx


3. Now (unintuitively at least to me) uninstall the helm chart with:

helm uninstall kibana

3. Then install the helm chart again with:

helm install kibana elastic/kibana -f /tmp/kibana.yaml

And that's it. Your changes will be applied and you're good to go.

I'm pretty sure there's a way to create a configMap and reference it, which would then allow you to just delete the pod to have it re-read the configMap, but I haven't figured out those exact details. Maybe in another post.

Tuesday, March 21, 2023

Installing .pak Files on WebSphere Application Server 8.5.x

Background

In WAS 7.0 (and possibly earlier), the WebSphere Update Installer was used to install WAS fix packs, which would have a file extension of .pak. Additionally, some other software (IBM Security Identity Manager 6, for example) that runs on WAS decided to package their updates in the same way, with .pak files to be installed with the Update Installer. WAS 8.5 moved to using IBM Installation Manager for its installation and the installation of fix packs. The last version of the WebSphere Update Installer is 7.0.0.45.

Let's say after you installed ISIM 6 on WAS 7, and then later upgraded WAS to 8.5. How do you install an ISIM 6 fixpack onto WAS 8.5?

Solution

You use the WAS 7.0.0.45 Update Installer, of course! 

WebSphere Update Installer is actually a standalone product that isn't reliant on any particular version of WebSphere to be installed. Its version number does its best to throw you off, but it works just fine when run against WAS 8.5 (or even 8.5.5.23 in my latest test).

I couldn't find this spelled out anywhere, so I thought I would share.

Thursday, March 16, 2023

Installing additional software on the Rancher docker container

If you read one of my previous posts to install Rancher on a single docker container, you may have found that it doesn't include several commands like ping, netstat, ss, and even apt. And if you run 'uname -a', you might think that the image you're in is Ubuntu, but it's not. It's SUSE Linux (the same people who maintain Rancher), and the package manager there is accessed via the command 'zypper'. So to install several of the tools you know and love, run the following

zypper install net-tools iproute2 bind fping lsof

That's it. Now you have a few more tools for debugging.

Wednesday, March 15, 2023

Installing Rancher in a Single Docker Container on Ubuntu 20.04

This is MUCH easier than my last couple of posts because this just takes one step after you configure your OS. Rancher is a cloud native (runs on its own K8s/K3s cluster) K8s manager and container orchestration platform. It is a competitor to Red Hat OpenShift and VMWare Tanzu.

This solution is for a DEV/practice environment. 

I've uploaded the script to configure Ubuntu as a gist to Github. So all you need to do is start with a working install of Ubuntu 20.04 desktop (my test systems have been configured with 16 cores and 64GB RAM). Your user must have sudo access (you'll be prompted for the password as the scripts run) and you can run this script:


Now run this command:

docker run -d --restart=unless-stopped \
  -p 80:80 -p 443:443 \
  --privileged \
  rancher/rancher:latest

Now open your browser to http://localhost and follow the directions. It will instruct you how to get the password, then prompt you to change the password, and you're good to go. You have a local Rancher K3s cluster running in a docker container. From the UI you can probe your cluster configuration, install new applications, etc. One application of interest is:

Monitoring - This is similar to (though not exactly) the kube-prometheus-stack, with Prometheus, Grafana, and several Grafana dashboards configured.

To access the cluster from the CLI, you first need to get the container-id of your rancher container with:

docker ps

Then run:

docker exec -it container-id /bin/bash

At this point you have a root shell with access to the kubectl command.

Another application that will probably interest you is Elasticsearch. Be prepared for a LOT of failure if you try to install this one. I simply could not get it to install, and I could not determine why it failed. I couldn't find any useful logs describing where it was getting hung up. If you can figure it out, please let me know. I will keep on trying.

Update 3/16/2023: I was able to get Elasticsearch installed, and I can verify via curl to port 9200 that it's running, but that's it. I can't get any logs sent to it because the Logging app won't let me configure anything. And while I can install Kibana, I cannot figure out how to access the UI once it's installed. I've tried quite a few different things, but it's not working.

To get Elasticsearch installed, you need to perform some additional steps:

Create a directory like /home/mypv inside the Rancher docker container.
Set the owner of that directory to the user "rancher"
create a PersistentVolume in the Rancher UI to be a HostPath that points to /home/mypv with a size of 30Gi (to match the defaults for the Elasticsearch install)
In the Elasticsearch yaml, change the values of these two keys as listed here:

replicas: 1
minimumMasterNodes: 1

But, like I said, you won't be able to actually do anything with it at this point.