Wednesday, July 12, 2017

Using IBM Agile Service Manager and BigFix to obtain and display application communication topology data

Background

We've been working with a client who owns BigFix and Netcool Operations Insight, and who recently purchased the optional Agile Service Manager component of NOI. Up until now, we've been helping this customer obtain communication data (network/port/process connection information) in their environment through BigFix. A valid question you may have is: Doesn't TADDM do that and more? And the answer is yes it does, but the customer has some fairly severe obstacles that prohibit a successful deployment of TADDM.

Why are we doing this?

Any Operations group needs as much contextual information as possible to allow them to do their job effectively. Some of the information that Operations teams need is:

- Which systems are communicating with (dependent upon) Server X?

- What processes and applications are running on Server X?

- What is the impact to other systems if we reboot Server X?

etc. There are many, many more questions that come up, and often the best way to answer those questions is with a topology view of the environment. TADDM gives you this topology information, but again, this client is not able to install TADDM, so wanted another way to get similar data.

How are we doing it?

The first challenge was getting the communication information via BigFix. With just a little searching, we realized that this was actually very easy. The 'netstat' command in both Windows and Linux will actually show you information about which ports are owned by/in use by which processes, and then it's just a matter of getting more details about each PID. Linux has the 'ps' command, and Windows PowerShell does too, though the output is different, of course. We also found that PowerShell has a few functions that will directly convert command output into XML. This is important because BigFix includes an XML inspector that lets you report on data that's in an XML file. On Linux, a little Perl scripting was used to accomplish the same goal.

So with the IP/port/process information in had, we then needed to display that data in the ASM Topology Viewer. To do that, we used the included File Observer. Specifically, we wrote a script to create the appropriate nodes and edges so that this information can be displayed by ASM.

What's it look like?


Here you can see that a java process on client.gulfsoft.com has opened TCP port 40474 to communicate with a DB2 process listening on port 50000 on db2srv.gulfsoft.com.

Conclusion

Topology data is absolutely crucial to a Operations team for numerous reasons. In this case, we were able to provide this visualization to our client in a very short amount of time (a week or so) while leveraging software they already owned. They now have better insight into their environment and are better prepared to address events in their environment.

Thursday, July 6, 2017

A Windows command similar to awk

I'm always amazed at the capabilities available with built-in Windows command line tools. My latest find is the FOR /F command, documented here:

https://ss64.com/nt/for_cmd.html

My main use for the awk command in *NIX is to pull out some piece of a line of text. I know awk is MUCH more powerful and even has its own robust language, but I've always used it to pull pieces of text out of structured output. And that's what FOR /F does for you. The syntax is completely different, but the capability is there and it's quite powerful.

Friday, June 30, 2017

Now you can get started with Artificial Intelligence on a Raspberry Pi

Microsoft made its AI work on a $10 Raspberry Pi https://www.engadget.com/amp/2017/06/30/microsoft-made-its-ai-work-on-a-10-raspberry-pi/

Thursday, June 29, 2017

More IBM Netcool Agile Service Manager Videos

I think some wires got crossed in YouTube recently as IBM Service Management moved over to the IBM Cloud channel, and it appears that their most recent videos are hidden from any searches. However, thanks to Matt Duggan from IBM who shared the direct links on LinkedIn, I've added them all to my own IBM Agile Service Manager playlist, which can be found here:

https://www.youtube.com/playlist?list=PLxv2WlaeOSG9z_L4LCjHzz-qnZ-vDqnjn

Have fun

Tuesday, June 27, 2017

IBM Netcool Agile Service Manager - What is swagger?

Introduction

The ASM documentation references "swagger" and "swagger URLs" for several different services. The purpose of this post is to describe what this actually means.

What is swagger?

Here's a statement from swagger.io:

The goal of Swagger™ is to define a standard, language-agnostic interface to RESTAPIs which allows both humans and computers to discover and understand the capabilities of the service without access to source code, documentation, or through network traffic inspection.

So the goal of this article is to show what that statement actually means to you in the context of Agile Service Manager.

Swagger URLs for ASM

There are 7 different services that are accessible via a browser. My ASM host is named "asm", and here are the URLs I have for the services:

File Observer Swagger UI
http://asm:9098/1.0/topology/observer/swagger/#/
        
topology-service Swagger UI
http://asm:8080/1.0/topology/swagger#/ 
        
search service Swagger UI
http://asm:7080/1.0/search/swagger  
        
ITNM observer Swagger UI
http://asm:9080/1.0/topology/observer/swagger   
        
OpenStack observer Swagger UI
http://asm:9082/1.0/topology/observer/swagger   
        
Event observer Swagger UI
http://asm:9084/1.0/topology/observer/swagger 
        
Docker observer Swagger UI
http://asm:9086/1.0/topology/observer/swagger 

Topology Service

The Topology Service is the one that will be the one you normally want to visit to view (and even change) data about the resources in the ASM database. Here's what you'll see when you access the URL:

You can click on each section to see the operations associated with each. The section I like is Resources. Here are the operations found there:


From here, you can click on one of the operations, such as the first one: GET /resources. Here's just the first part of what's displayed there:


Notice that it gives you documentation about the operation and lots of other information. Specifically, it provides you with the ability to fill in values for all of the parameters that the operation accepts AND allows you to execute the operation! It also provides you with the 'curl' command that you can run from the command line to execute the exact same operation, with the exact same parameters.

The way to execute the operation is to click the "Try it out!" button at the bottom of the operation documentation.


And there you go! Some data. In this case, what's returned is the ID of the node in the topology that matches the criteria I specified. I can then take this ID and use it as input to other operations in this same group or in other groups.

Try it out and have fun

The above is just an short entry point into ASM's swagger UIs. Play around with them and you'll see that you can do some interesting stuff.

Monday, June 26, 2017

Agile Service Manager UI Introduction

Here's a short video introduction covering the basic features of IBM's Netcool Agile Service Manager.


IBM Netcool Agile Service Manager Thoughts

I recently installed IBM's Netcool Agile Service Manager and wanted to give my initial thoughts on it.

What is Agile Service Manager?


Basically, it's a real-time topology viewer for multiple technologies. Specifically, it can currently render topology data for ITNM, OpenStack and Docker, all in one place. Additionally, it maps events to the topology so you can see any events that are affecting a resource in the context of its topology. So, for example, if you receive a CRITICAL event for a particular Docker container, you will see the node representing that container turn red. Pretty neat. Here's an example of a 1-hop topology of my ASM server's docker infrastructure (you always have to start at some resource to view a topology):


What's so great about it?

Combined Topology View

First, this topology view is wonderful for Operations and Development because it shows a topology view of your combined Network, Docker and Openstack environments, so everyone can see where applications are running and the dependencies among the pieces.

ElasticSearch

Second, it's got ElasticSearch under the covers, so updates and searches are amazingly fast, and the topology view is built extremely quickly.

Custom Topology Information

Third, you can add your own topology information to make it even more useful!

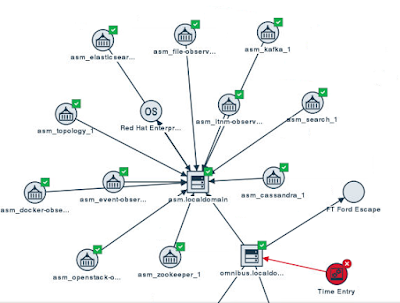
Here's a screenshot where I've manually modified the topology using a combination of the File Observer and direct access to the Topology Service REST API (from the Swagger URL):


Notice also that Time Entry is in a Critical state. That's due to an event that I generated.

History

Fourth, it maintains history about the topology. That means that you can view the difference in topology between 2 hours (or two days) ago and right now.

Is ASM a complete replacement for TBSM and/or TADDM?


No, ASM is not a complete replacement for TBSM or TADDM, but you can definitely think of it as "TBSM Lite". TBSM still has some very unique features, such as status propagation, service rules, and custom KPIs that can be defined on a per-business-service basis.

And TADDM's unique capability is the hard work of actually discovering very detailed data and relationships in your environment.

However, because the search and visualization pieces of ASM are so fast and efficient, I can definitely see ASM being used as at least part of the visualization portion of  TADDM. What would be required to allow this is a TADDM Observer to be written.

Additionally, I think the ASM database and topology will in the future be leveraged by TBSM, though this will take a little work.

Parting thoughts

ASM is a truly useful product, with some great capabilities. It's also incredibly easy to install if you've already got Netcool Operations Insight (or at least DASH) installed - I was able to get it installed in just a few hours. I'm certain IBM will be adding features and add-ons to provide even more functionality in the coming months.